
Atlanta Falcons 45 · New Orleans Saints 24
Team assessments and season evidence from our Week 4 recap.
Caesars Superdome · 2026-10-05
The final score was Atlanta Falcons 45 · New Orleans Saints 24. The breakdown below uses this game’s figures, separate from season averages.
The scoring path
| Team | Q1 | Q2 | Q3 | Q4 | Final |
|---|---|---|---|---|---|
| Atlanta Falcons | 14 | 10 | 7 | 14 | 45 |
| New Orleans Saints | 0 | 7 | 3 | 14 | 24 |
| Measure | Atlanta Falcons | New Orleans Saints |
|---|---|---|
| First downs | 24 | 22 |
| Total yards | 420 | 320 |
| Yards per play | 7.5 | 4.6 |
| Passing yards | 215 | 270 |
| Rushing yards | 205 | 50 |
| Third-down conversions | 4-8 | 6-15 |
| Red-zone touchdowns / trips | 4-5 | 3-4 |
| Giveaways | 0 | 1 |
| Possession time | 30:45 | 29:15 |
Third-down conversion is shown as its own measure. It is not a substitute for overall play success rate. A dash means the source did not supply that field.
The Lab’s result test
Atlanta Falcons won by 21 points. Q1 supplied the largest scoring swing in the winner’s favor, a +14-points period. The chart shows the result’s path; the box score helps explain what created it.
Atlanta Falcons produced 420 total yards; New Orleans Saints produced 320. Yardage describes how much ground was gained, not whether the most valuable drives were finished.
Atlanta Falcons committed 0 giveaways against the opponent’s 1. That possession advantage gave the winner fewer mistakes to overcome.
The next test is repeatability. Separate staying on schedule from long gains, then examine field position and drive finishing. A large yardage total can coexist with missed scoring chances; a short field can make a modest drive valuable.
Our game coverage
A matching published game video is not available in the verified archive yet.
Game played 2026-10-05. These assessments cover the season through October 5, 2026, including this game.
Read the complete Week 4 article →
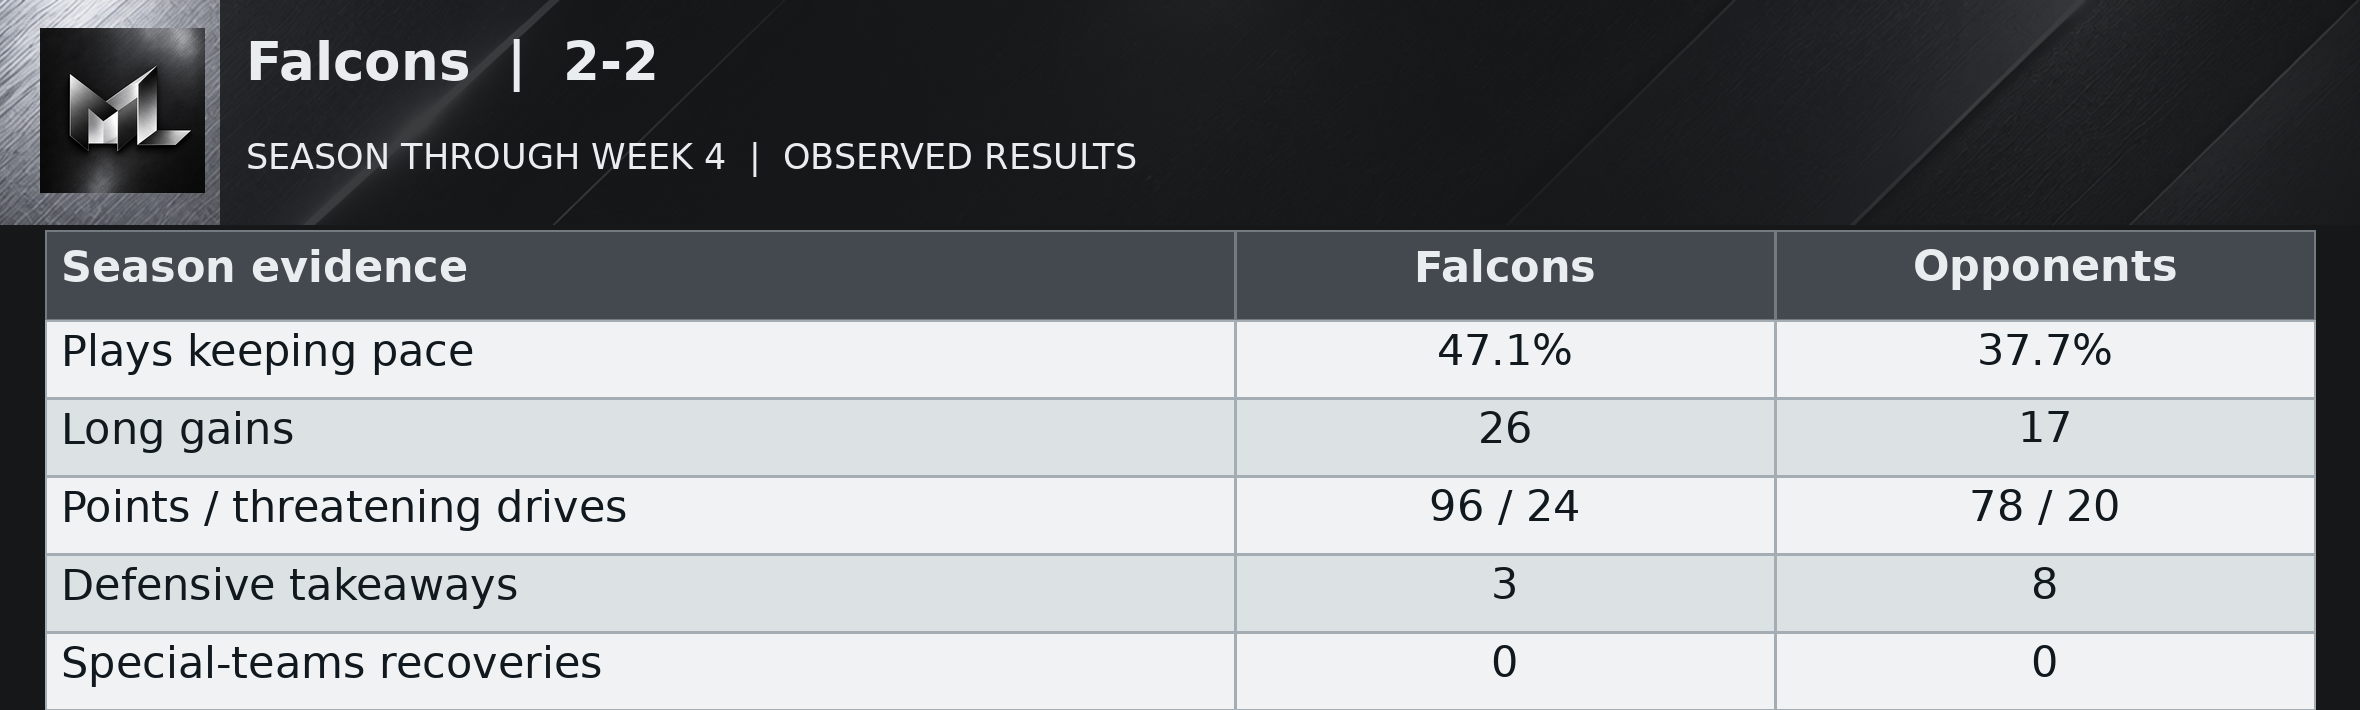
Falcons | 2-2
Read the table as text
| Season evidence | Falcons | Opponents |
|---|---|---|
| Plays keeping pace | 47.1% | 37.7% |
| Long gains | 26 | 17 |
| Points / threatening drives | 96 / 24 | 78 / 20 |
| Defensive takeaways | 3 | 8 |
| Special-teams recoveries | 0 | 0 |
Atlanta's season divides cleanly into two halves. Its offense kept moving on only 36.8 and 34.3 percent of plays in the first two games, then 59.4 and 59.3 percent in the last two. The scores followed: 16 combined points became 80. Michael Penix Jr.'s return coincides with that improvement, but two excellent games are still a change in direction rather than proof of four-game consistency. The defense's season record is stronger, allowing useful gains on 37.7 percent of plays.
Kevin Stefanski said Penix “took care of the football”. Monday's clean game supports the claim, as do Atlanta's one giveaway across the two wins compared with seven across the two losses. The Falcons ran for 205 yards while allowing New Orleans only 50 and scored 45 points on eight threatening possessions. That was production beyond the early short-field touchdown following Kendre Miller's fumble. The remaining concern is whether the cleaner offense persists when it loses Monday's comfortable starting positions. The early disasters still count, even after the fun returns.
After opponent punts or failed fourth downs, Falcons possessions have begun at their own 25.2, on average, across 21 competitive drives. The weekly average has varied widely, from their own 16.2 to their own 37.5. The latest game averaged their own 37.5. The resulting possession started at midfield or closer to the end zone in 2 of those 21 cases. These are actual starting spots, including punt returns, rather than a measure of the defense alone. The return unit has added 87 punt-return yards over the season. Pre-snap changes before the first run or pass affected 2 of these drives; those changes are excluded from the listed starting spots. Starts following turnovers are counted separately: 2 competitive possessions at their opponent 23.5 on average.
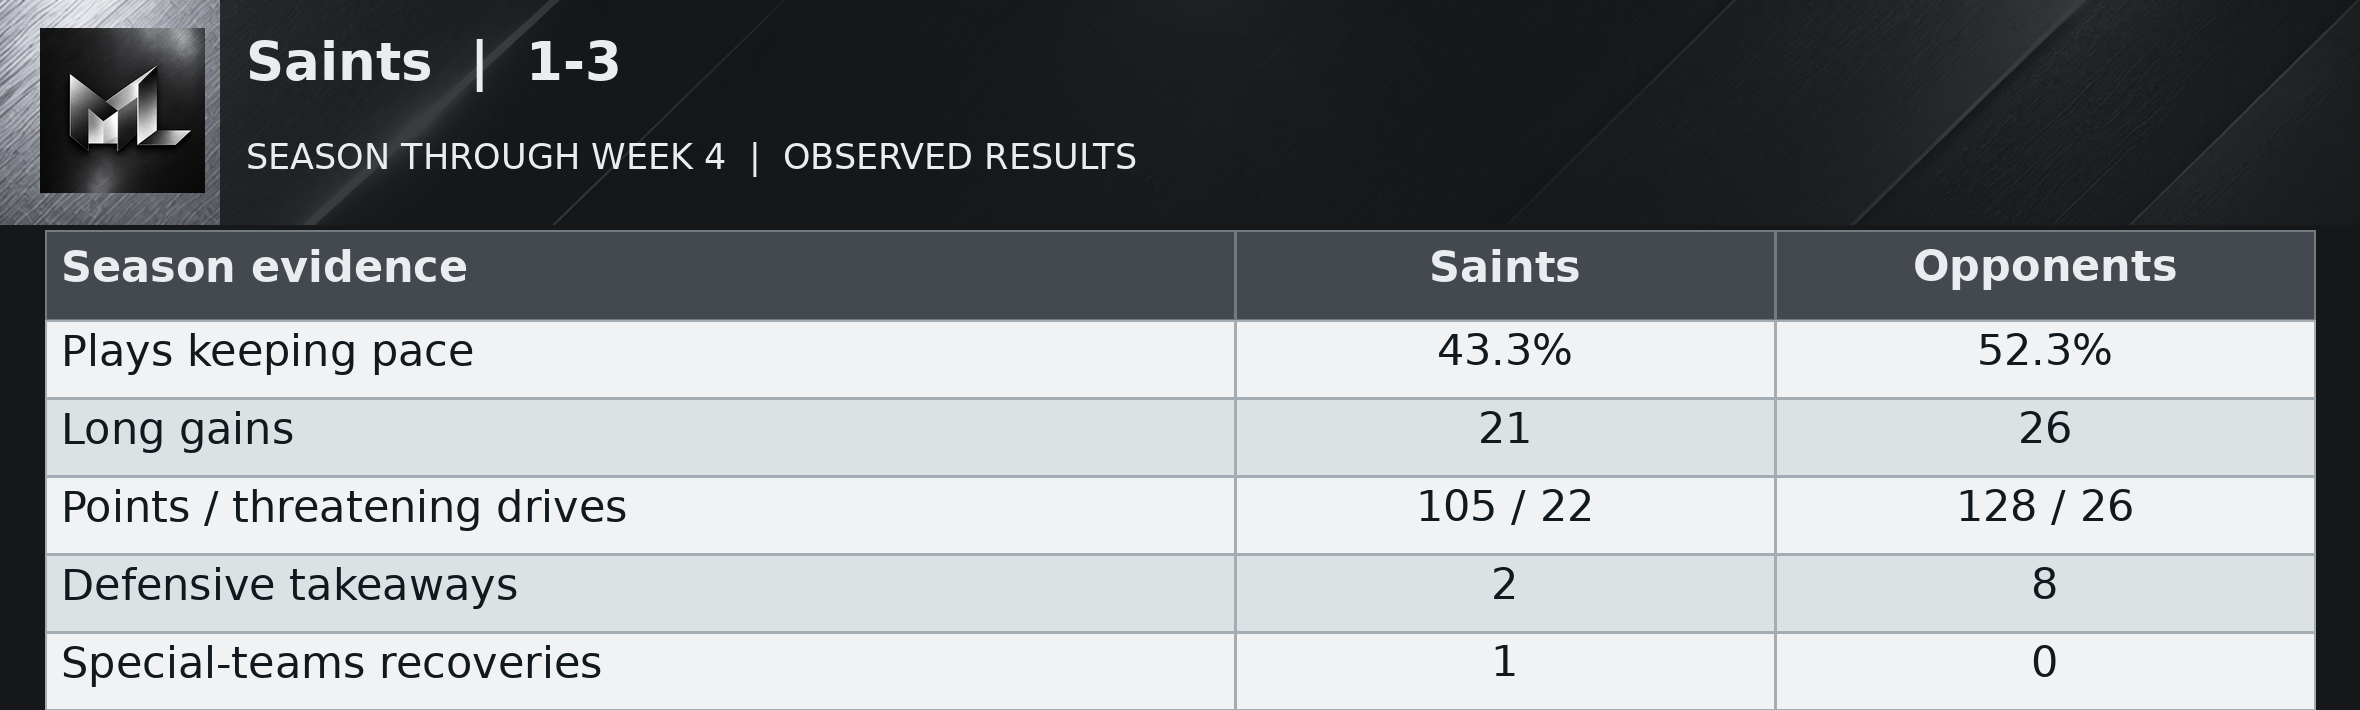
Saints | 1-3
Read the table as text
| Season evidence | Saints | Opponents |
|---|---|---|
| Plays keeping pace | 43.3% | 52.3% |
| Long gains | 21 | 26 |
| Points / threatening drives | 105 / 22 | 128 / 26 |
| Defensive takeaways | 2 | 8 |
| Special-teams recoveries | 1 | 0 |
New Orleans has repeatedly allowed opponents to move and finish with less resistance than its own offense receives. Opponents have made useful gains on 52.3 percent of plays, against the Saints' 43.3, and taken 128 offensive points from 26 threatening drives. The Saints have returned 105 from 22. Their offensive movement peaked in Week 3 but came with four giveaways. Monday brought fewer mistakes and still a 45-24 defeat, so possession alone does not explain the season's defensive problem.
Tyler Shough called the performance “embarrassing”. Allowing 205 rushing yards while producing 50, then watching Atlanta score on eight threatening possessions, gives the word numerical support. Kendre Miller's fumble created an early short field, and defensive holding extended the resulting touchdown drive. Those were two distinct forms of assistance. Only two of New Orleans's three team takeaways came from the defense; the other was on special teams. Eight giveaways, all outside special teams, have repeatedly added pressure to a defense already struggling without that help.
After opponent punts or failed fourth downs, Saints possessions have begun at their own 23.1, on average, across 15 competitive drives. The weekly average has varied widely, from their own 16.5 to their own 29.3. The latest game averaged their own 16.5. The resulting possession started at midfield or closer to the end zone in 0 of those 15 cases. These are actual starting spots, including punt returns, rather than a measure of the defense alone. The return unit has added 47 punt-return yards over the season. Pre-snap changes before the first run or pass affected 2 of these drives; those changes are excluded from the listed starting spots. Starts following turnovers are counted separately: 2 competitive possessions at their opponent 46.0 on average.