
Unbeaten. Still Unconvincing.
What happened through Week 4. All 32 teams, 16 final scores and the season evidence behind the records.
The Matchup Lab · 2026-10-06

Jump to a team or section
ESPN’s completed-game scoreboards confirm the Week 4 final scores below. The Matchup Lab’s original season assessments retain their October 5 statistical cutoff.
The Matchup Lab | Season performance through October 5 2026
Unbeaten. Still Unconvincing.
Four games are enough to establish a few habits. San Francisco keeps finding useful gains and denying long ones. Minnesota keeps making opponents miserable while asking its own offense to do less. The Rams keep giving the ball away twice. Records tell us where those habits have landed, but they do not excuse them. This is a review of the season through Week 4, with the latest game used to test what has held up, what has improved and what still falls apart.
All 32 teams are assessed after 64 completed games. The Week 4 slate includes all 16 finals from October 1 through October 5, ending with Atlanta beating New Orleans 45-24 on Monday night. There were no Week 4 byes and no unfinished games at the cutoff.
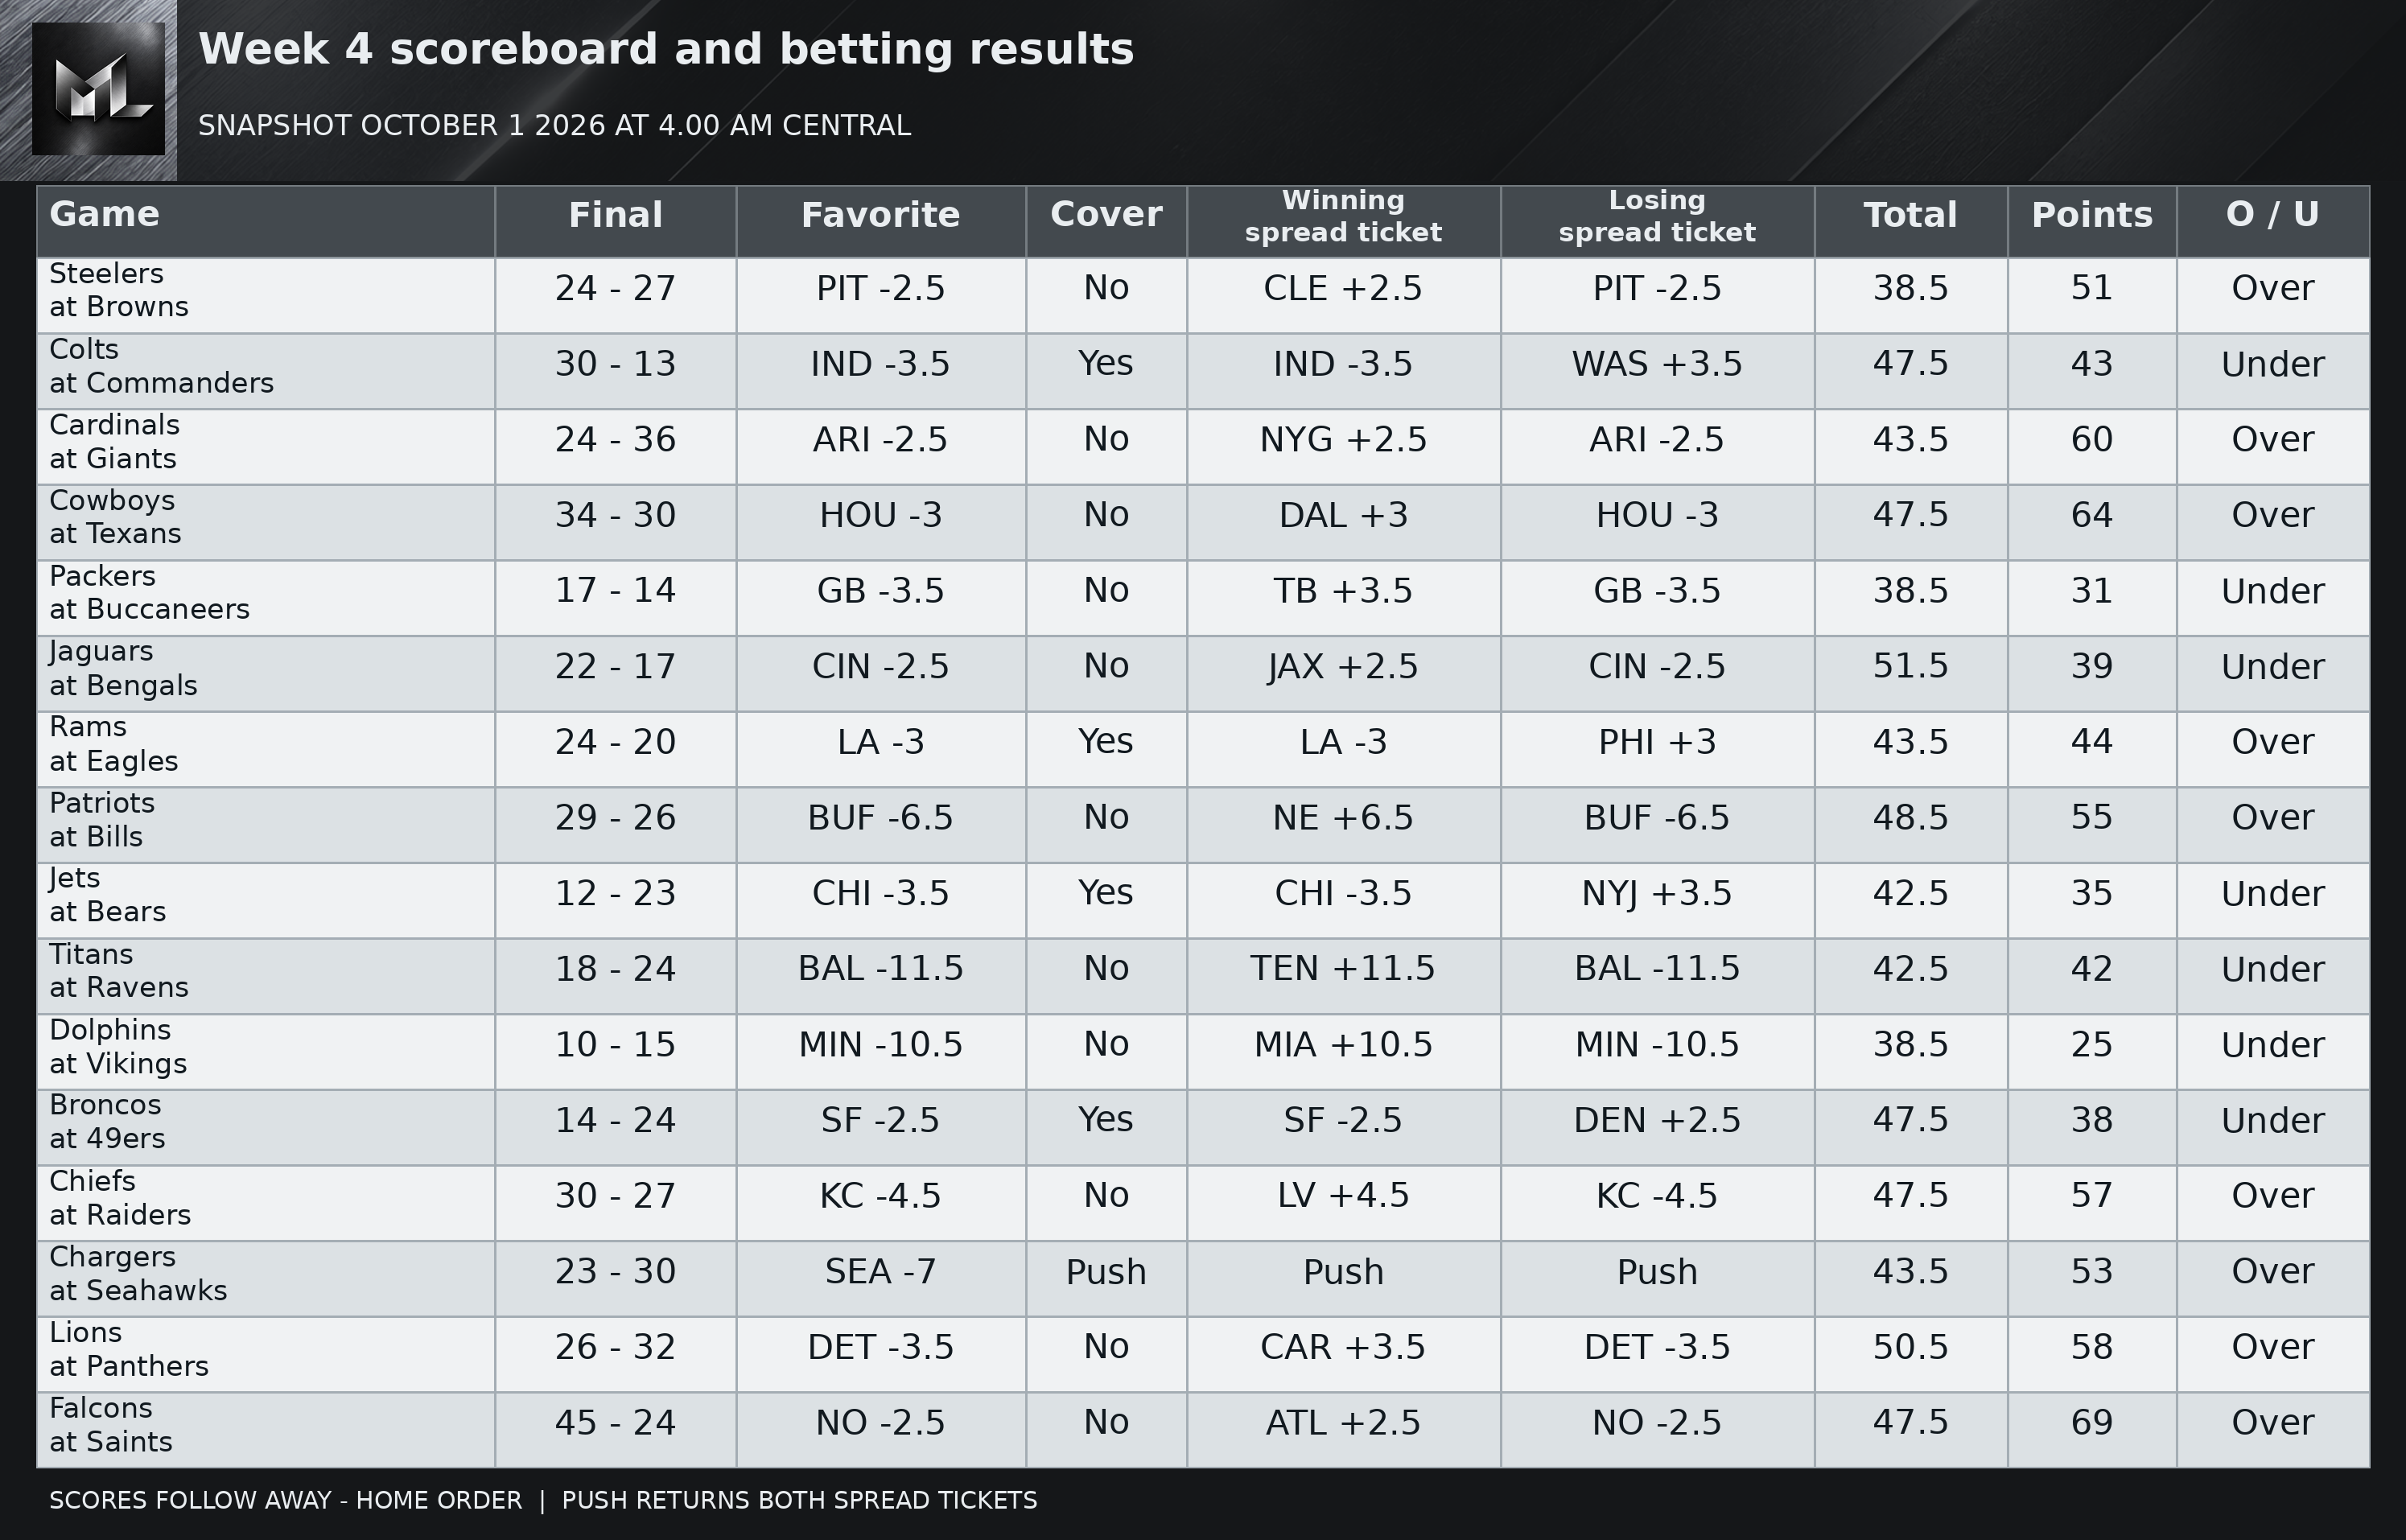
Read the table as text
| Game | Final | Favorite | Cover | Winning spread ticket | Losing spread ticket | Total | Points | O / U |
|---|---|---|---|---|---|---|---|---|
| Steelers at Browns | 24 - 27 | PIT -2.5 | No | CLE +2.5 | PIT -2.5 | 38.5 | 51 | Over |
| Colts at Commanders | 30 - 13 | IND -3.5 | Yes | IND -3.5 | WAS +3.5 | 47.5 | 43 | Under |
| Cardinals at Giants | 24 - 36 | ARI -2.5 | No | NYG +2.5 | ARI -2.5 | 43.5 | 60 | Over |
| Cowboys at Texans | 34 - 30 | HOU -3 | No | DAL +3 | HOU -3 | 47.5 | 64 | Over |
| Packers at Buccaneers | 17 - 14 | GB -3.5 | No | TB +3.5 | GB -3.5 | 38.5 | 31 | Under |
| Jaguars at Bengals | 22 - 17 | CIN -2.5 | No | JAX +2.5 | CIN -2.5 | 51.5 | 39 | Under |
| Rams at Eagles | 24 - 20 | LA -3 | Yes | LA -3 | PHI +3 | 43.5 | 44 | Over |
| Patriots at Bills | 29 - 26 | BUF -6.5 | No | NE +6.5 | BUF -6.5 | 48.5 | 55 | Over |
| Jets at Bears | 12 - 23 | CHI -3.5 | Yes | CHI -3.5 | NYJ +3.5 | 42.5 | 35 | Under |
| Titans at Ravens | 18 - 24 | BAL -11.5 | No | TEN +11.5 | BAL -11.5 | 42.5 | 42 | Under |
| Dolphins at Vikings | 10 - 15 | MIN -10.5 | No | MIA +10.5 | MIN -10.5 | 38.5 | 25 | Under |
| Broncos at 49ers | 14 - 24 | SF -2.5 | Yes | SF -2.5 | DEN +2.5 | 47.5 | 38 | Under |
| Chiefs at Raiders | 30 - 27 | KC -4.5 | No | LV +4.5 | KC -4.5 | 47.5 | 57 | Over |
| Chargers at Seahawks | 23 - 30 | SEA -7 | Push | Push | Push | 43.5 | 53 | Over |
| Lions at Panthers | 26 - 32 | DET -3.5 | No | CAR +3.5 | DET -3.5 | 50.5 | 58 | Over |
| Falcons at Saints | 45 - 24 | NO -2.5 | No | ATL +2.5 | NO -2.5 | 47.5 | 69 | Over |
Favorites covered 4 games and underdogs covered 11, with 1 spread push. Totals produced 9 overs, 7 unders and 0 pushes. The four settled spread-total combinations were favorite and over 1, favorite and under 3, underdog and over 7, and underdog and under 4. The spread-push game is counted separately.
Spreads and totals reflect the October 1 2026 observation at 4.00 AM Central and can change before kickoff. Recap results are graded against that recorded snapshot, which is not asserted to be a closing line. These prices are provided for information and do not guarantee results.
Reading the season assessments
The team images show observed season results. Long gains mean runs of at least 10 yards or passes of at least 20. A play keeps pace when it gains half the required yards on first down, 70 percent on second down or all required yards on third and fourth down. Threatening drives reach the opponent’s 40-yard line or score a long offensive touchdown. Defensive or return touchdowns are not credited as offensive points. Starting spots after punts and failed fourth downs include return effects and are kept separate from turnover starts.
49ers | 4-0
Read the table as text
| Season evidence | 49ers | Opponents |
|---|---|---|
| Plays keeping pace | 53.6% | 43.4% |
| Long gains | 31 | 9 |
| Points / threatening drives | 122 / 24 | 64 / 19 |
| Defensive takeaways | 2 | 1 |
| Special-teams recoveries | 1 | 1 |
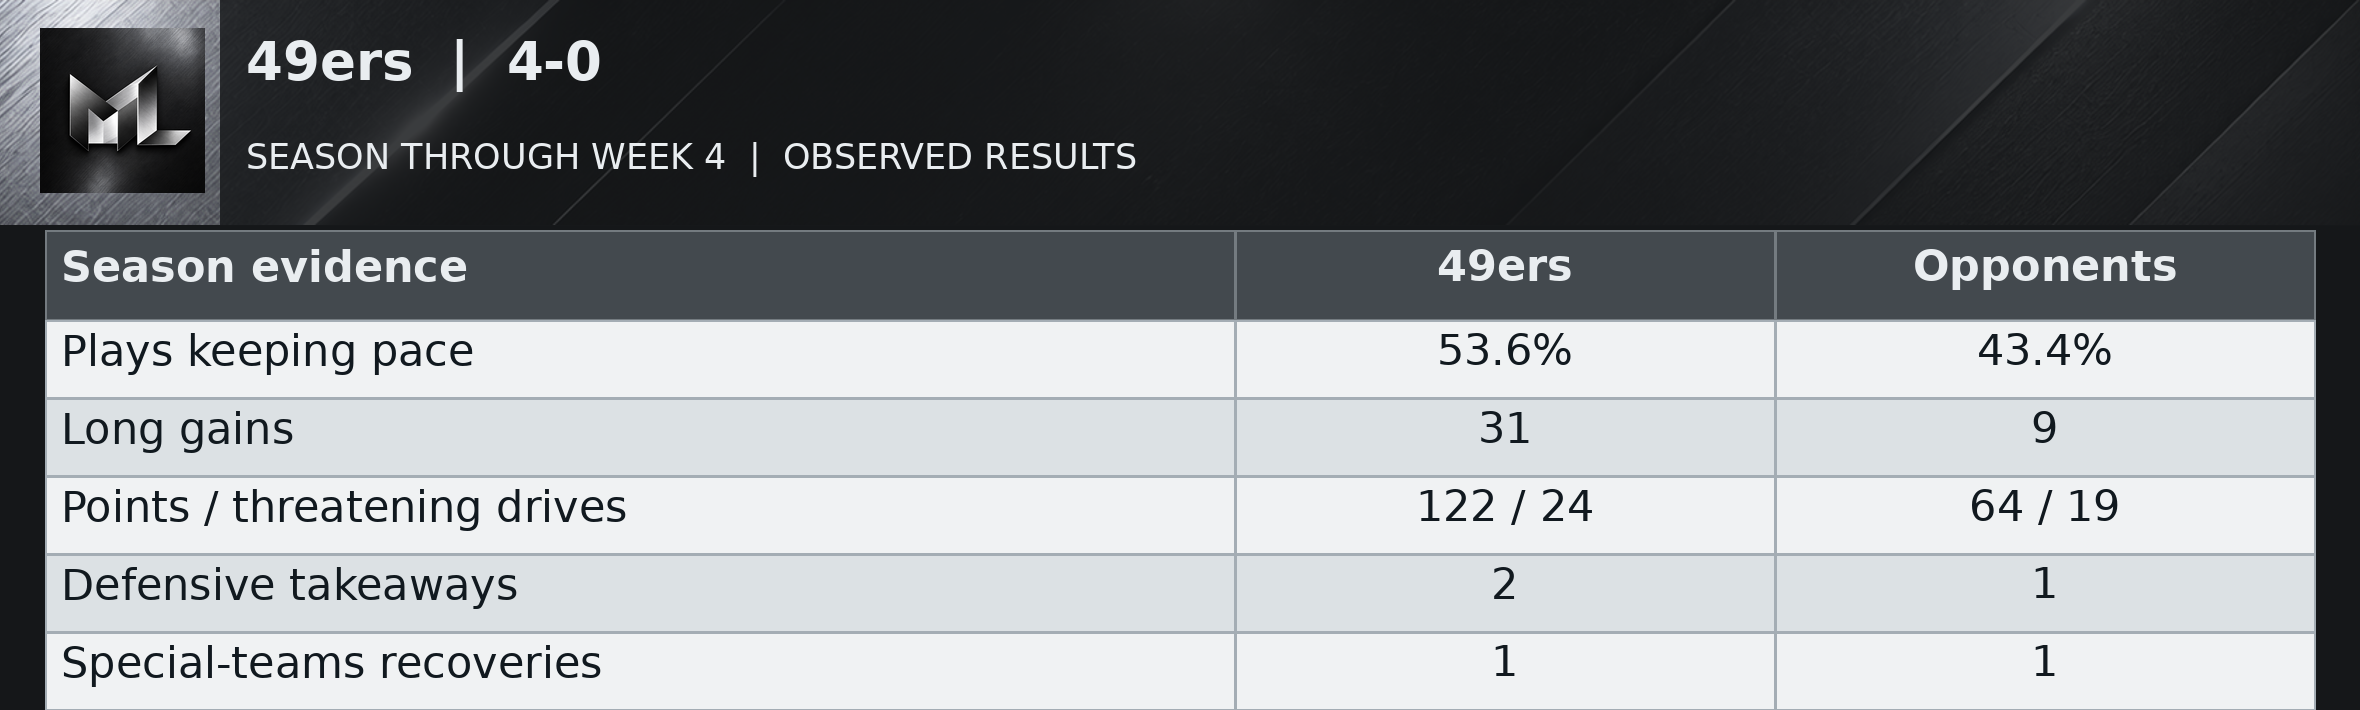
San Francisco has the strongest season case because its offense has repeatedly combined ordinary gains with the ability to shorten a possession in one snap. It has stayed ahead of the down on 53.6 percent of its qualifying plays and produced 31 long gains while allowing only nine. The 4-0 record has more underneath it than a collection of fortunate endings. Still, Sunday's 24-14 win was its weakest game at keeping possessions moving, and the opening seven possessions produced just three points.
Brock Purdy said he wanted to “just be ourselves”. That finally happened, but a muffed Denver punt helped open the door. The recovery was a special-teams play, not an interception or a strip by the defense. The subsequent 74-yard touchdown drive and George Kittle's 56-yard score were better evidence of what the offense can create for itself. Two giveaways through four games remain a strength. Being unbeaten does not exempt the slow start from review.
After opponent punts or failed fourth downs, 49ers possessions have begun at their own 21.4, on average, across 17 competitive drives. The weekly average has varied widely, from their own 12.8 to their own 37.2. The latest game averaged their own 12.8. The resulting possession started at midfield or closer to the end zone in 2 of those 17 cases. These are actual starting spots, including punt returns, rather than a measure of the defense alone. The return unit has added 25 punt-return yards over the season. Pre-snap changes before the first run or pass affected 1 of these drives; those changes are excluded from the listed starting spots. Starts following turnovers are counted separately: 3 competitive possessions at their own 47.7 on average.
Bears | 3-1
Read the table as text
| Season evidence | Bears | Opponents |
|---|---|---|
| Plays keeping pace | 45.2% | 42.2% |
| Long gains | 32 | 19 |
| Points / threatening drives | 112 / 26 | 65 / 19 |
| Defensive takeaways | 5 | 5 |
| Special-teams recoveries | 1 | 0 |
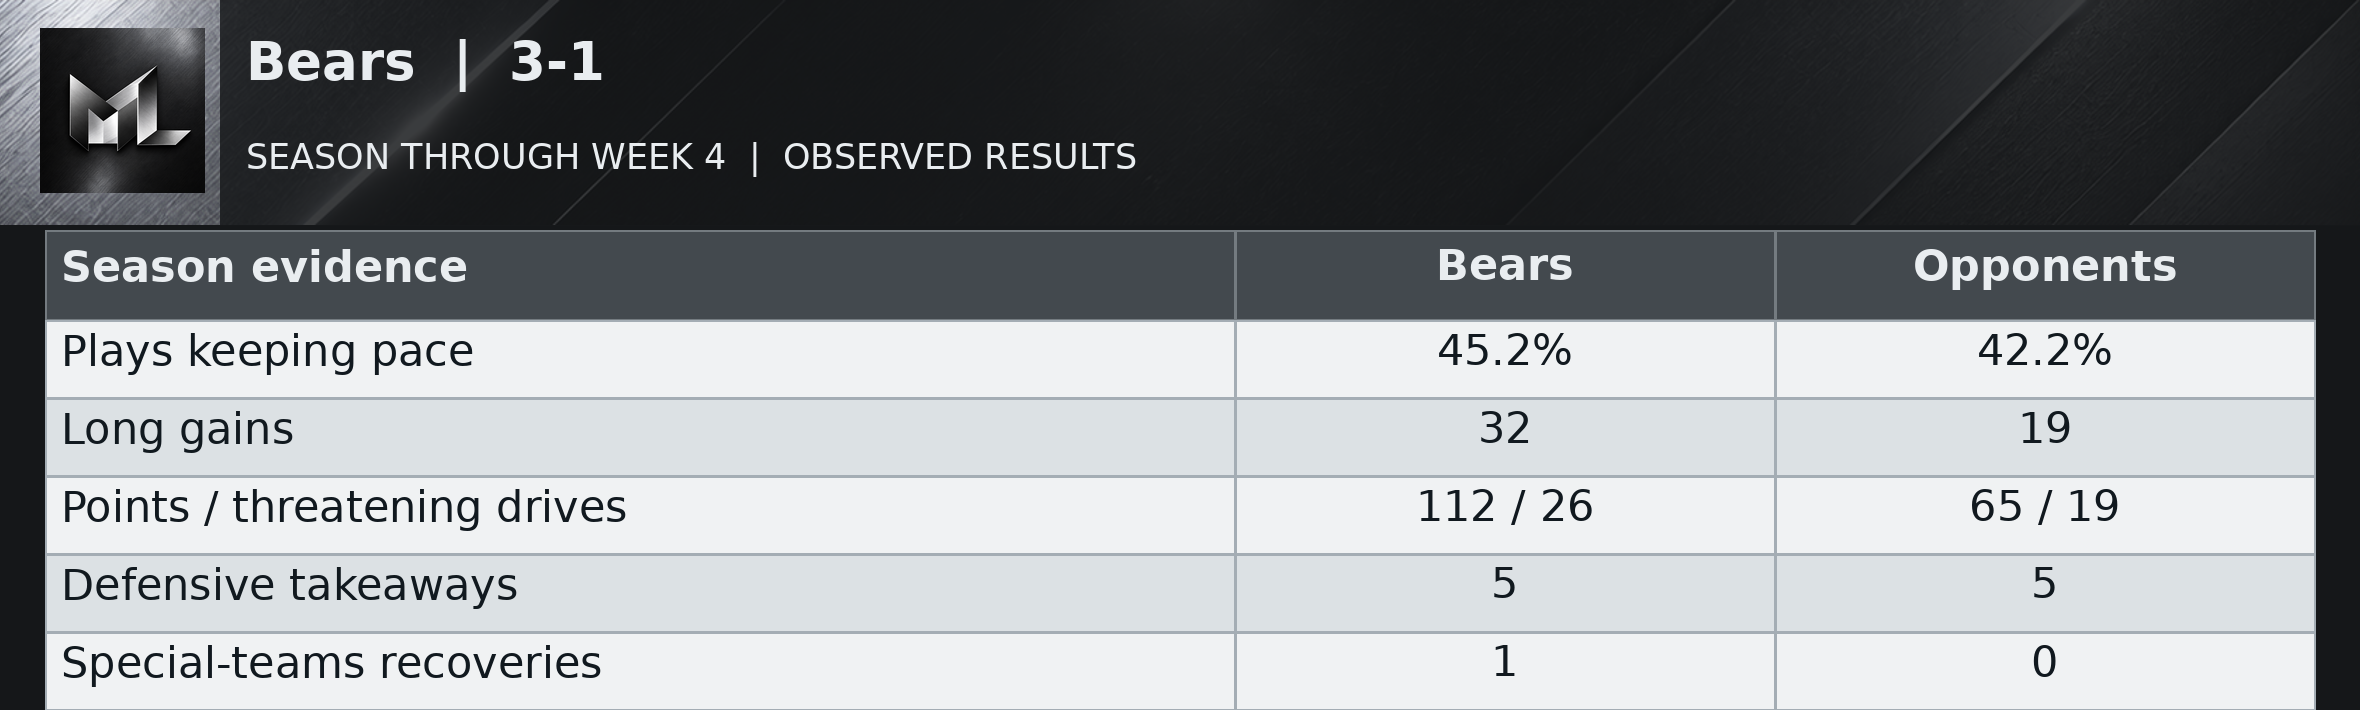
Chicago's offense has varied far more than its 3-1 record suggests. It scored 59 in the opener, three in the next game, then 27 and 23. The long gains have remained available, 32 across the season, but the offense has not consistently turned its visits near scoring territory into touchdowns. Its defense has been steadier at limiting the damage, allowing 65 offensive points on 19 threatening possessions. Five of the team's six takeaways were defensive, with the other coming on special teams.
Sunday supplied a different kind of stress test. The Bears ran 89 plays to the Jets' 32 and rushed for 232 yards, yet scored only 23 points. Their two giveaways and two touchdowns on seven red-zone visits kept a dominant possession game from becoming a dominant scoreboard. The model's threatening-drive count uses a broader definition and removes intentional kneel endings, so it is not that red-zone count. Winning with a different quarterback is a credit to the operation. Spending almost the entire afternoon with the ball should buy more separation.
After opponent punts or failed fourth downs, Bears possessions have begun at their own 28.2, on average, across 20 competitive drives. The weekly average has varied widely, from their own 23.6 to their own 37.8. The latest game averaged their own 23.6. The resulting possession started at midfield or closer to the end zone in 1 of those 20 cases. These are actual starting spots, including punt returns, rather than a measure of the defense alone. The return unit has added 84 punt-return yards over the season. Pre-snap changes before the first run or pass affected 1 of these drives; those changes are excluded from the listed starting spots. Starts following turnovers are counted separately: 6 competitive possessions at their own 49.3 on average.
Bengals | 2-2
Read the table as text
| Season evidence | Bengals | Opponents |
|---|---|---|
| Plays keeping pace | 45.3% | 43.8% |
| Long gains | 22 | 26 |
| Points / threatening drives | 90 / 23 | 78 / 22 |
| Defensive takeaways | 5 | 4 |
| Special-teams recoveries | 0 | 1 |
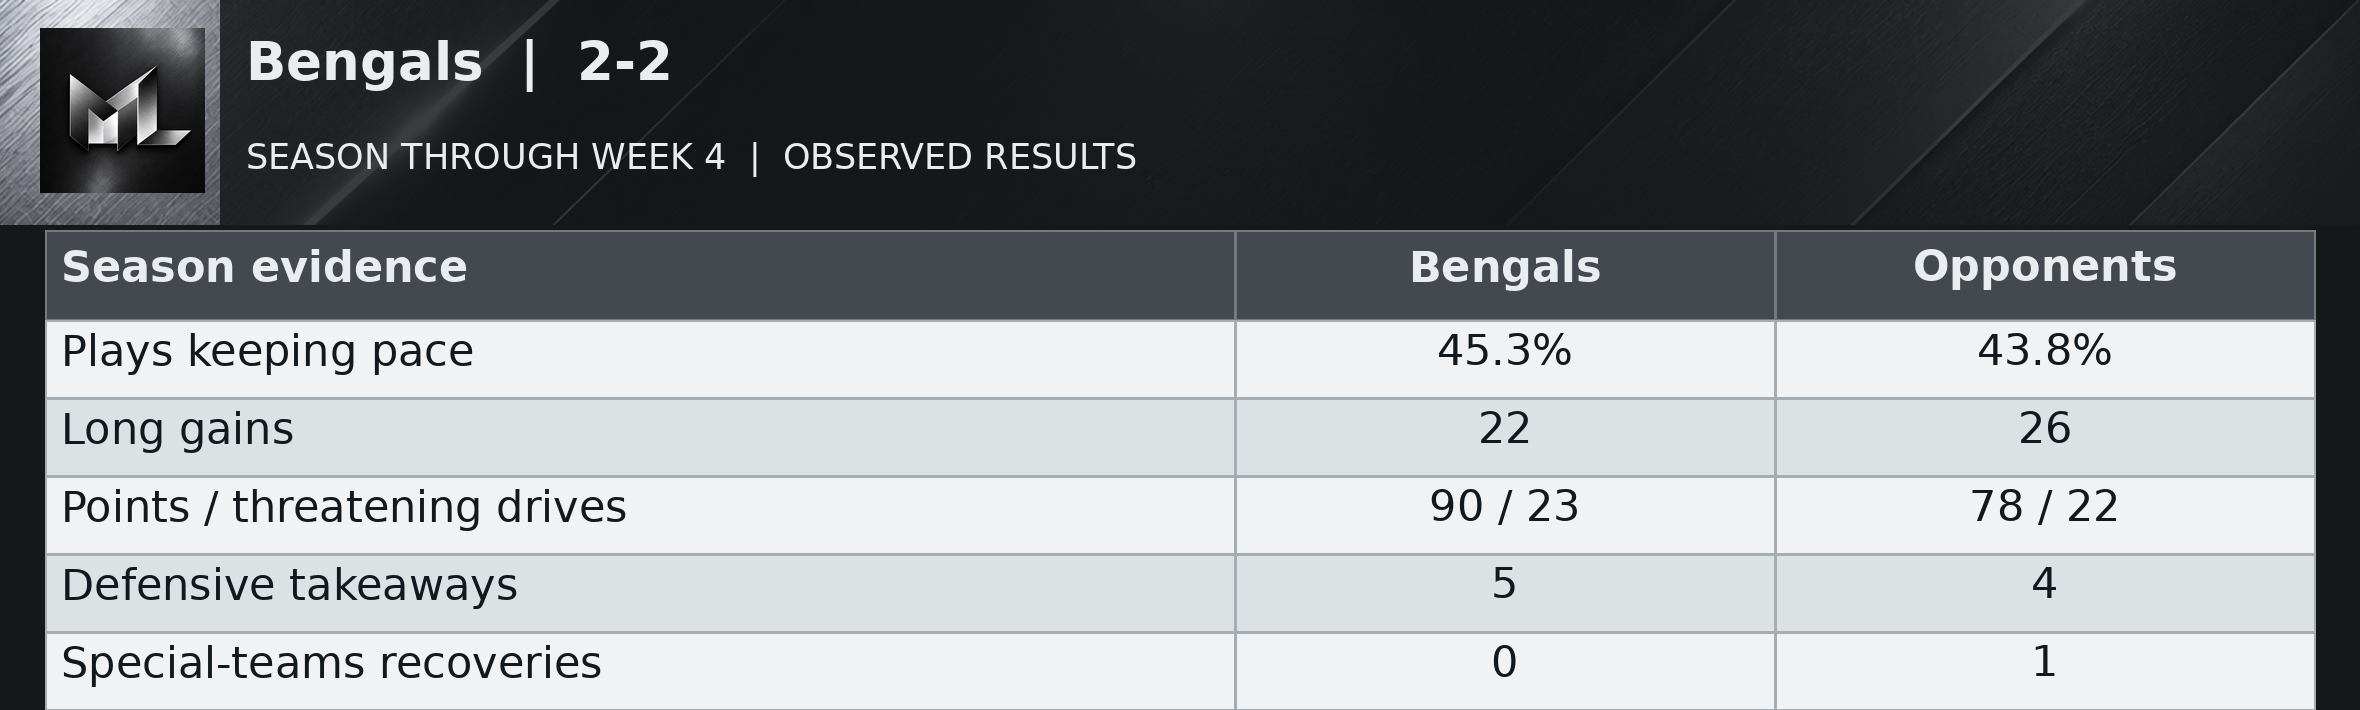
Cincinnati's offense has swung between productive stretches and stretches that depend on a rescue. Its weekly share of useful gains has run 50.0, 34.5, 51.8 and 45.1 percent, while the long gains slipped to three Sunday. Its 90 points from 23 threatening drives are respectable but not enough to erase the uneven execution. The defense has allowed 26 long gains against the offense's 22. The team has not built a dependable advantage from stopping big plays or finishing more effectively than opponents.
Joe Burrow singled out “the one in the red zone”. His concern about the interception in the 22-17 loss fits a recent pattern: two giveaways in each of the last two games. Four of the team's five defensive takeaways came in the opener. One of its five team-level giveaways was a special-teams mistake, so not every lost possession belongs to the offense. Cincinnati's 2-2 record reflects both a high enough ceiling to challenge good teams and too many possessions that require everything else to go right.
After opponent punts or failed fourth downs, Bengals possessions have begun at their own 29.5, on average, across 11 competitive drives. The weekly average has varied widely, from their own 15.7 to their own 34.6. The latest game averaged their own 15.7. The resulting possession started at midfield or closer to the end zone in 2 of those 11 cases. These are actual starting spots, including punt returns, rather than a measure of the defense alone. The return unit has added 28 punt-return yards over the season. Starts following turnovers are counted separately: 4 competitive possessions at their own 47.5 on average.
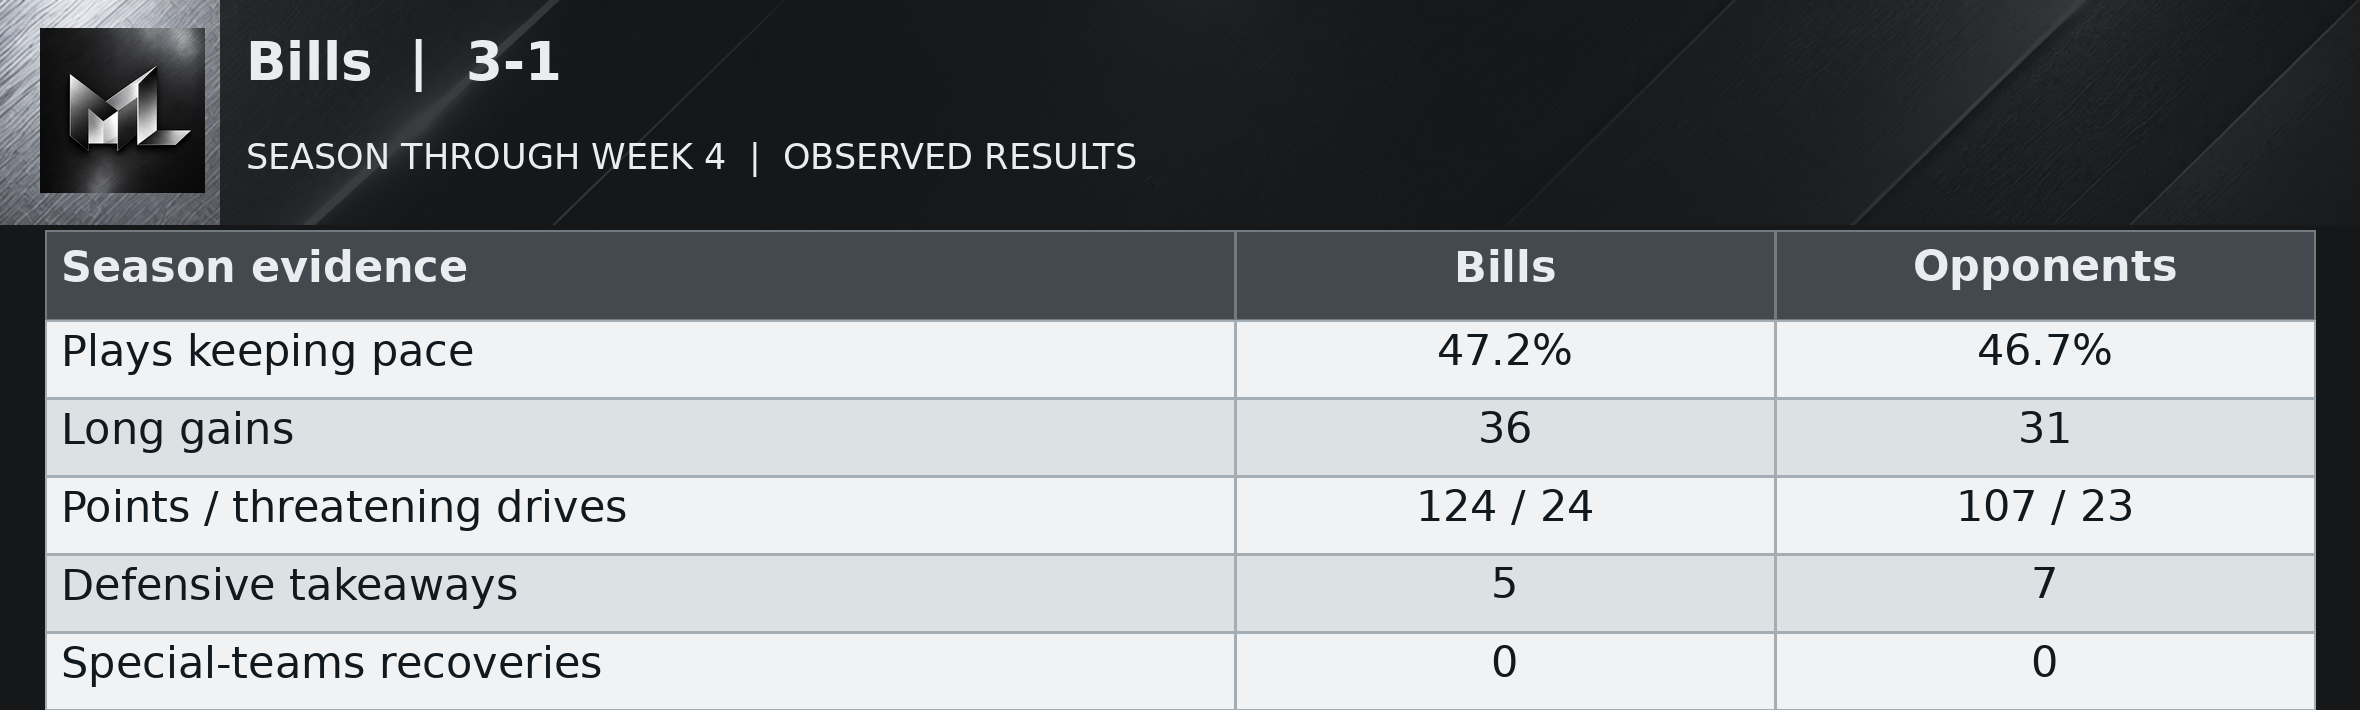
Bills | 3-1
Read the table as text
| Season evidence | Bills | Opponents |
|---|---|---|
| Plays keeping pace | 47.2% | 46.7% |
| Long gains | 36 | 31 |
| Points / threatening drives | 124 / 24 | 107 / 23 |
| Defensive takeaways | 5 | 7 |
| Special-teams recoveries | 0 | 0 |
Buffalo's offense has repeatedly found long gains and finished enough drives to win, but its defense has repeatedly invited opponents to answer. The Bills have 36 long gains against 31 allowed, and opponents have stayed on schedule on 46.7 percent of their plays. That leaves a 3-1 team with less room for offensive mistakes than its scoring talent suggests. The first two games were clean. Five giveaways in Week 3 and two more Sunday are a recent problem, rather than four weeks of identical carelessness.
Josh Allen said he should “live another day”. The late interception in the 29-26 loss made that lesson expensive. Buffalo collected two defensive takeaways, but New England still gained 405 yards and 26 first downs. The Bills' offense managed useful gains on only 40.7 percent of plays while eight long gains preserved its scoring chances. Their season finishing remains strong at 124 offensive points on 24 threatening drives. A defense that cannot end possessions makes each avoidable offensive mistake feel like a second assignment.
After opponent punts or failed fourth downs, Bills possessions have begun at their own 26.0, on average, across 16 competitive drives. The weekly average has varied widely, from their own 19.8 to their own 33.5. The latest game averaged their own 20.5. The resulting possession started at midfield or closer to the end zone in 2 of those 16 cases. These are actual starting spots, including punt returns, rather than a measure of the defense alone. The return unit has added 70 punt-return yards over the season. Starts following turnovers are counted separately: 3 competitive possessions at their own 46.7 on average.
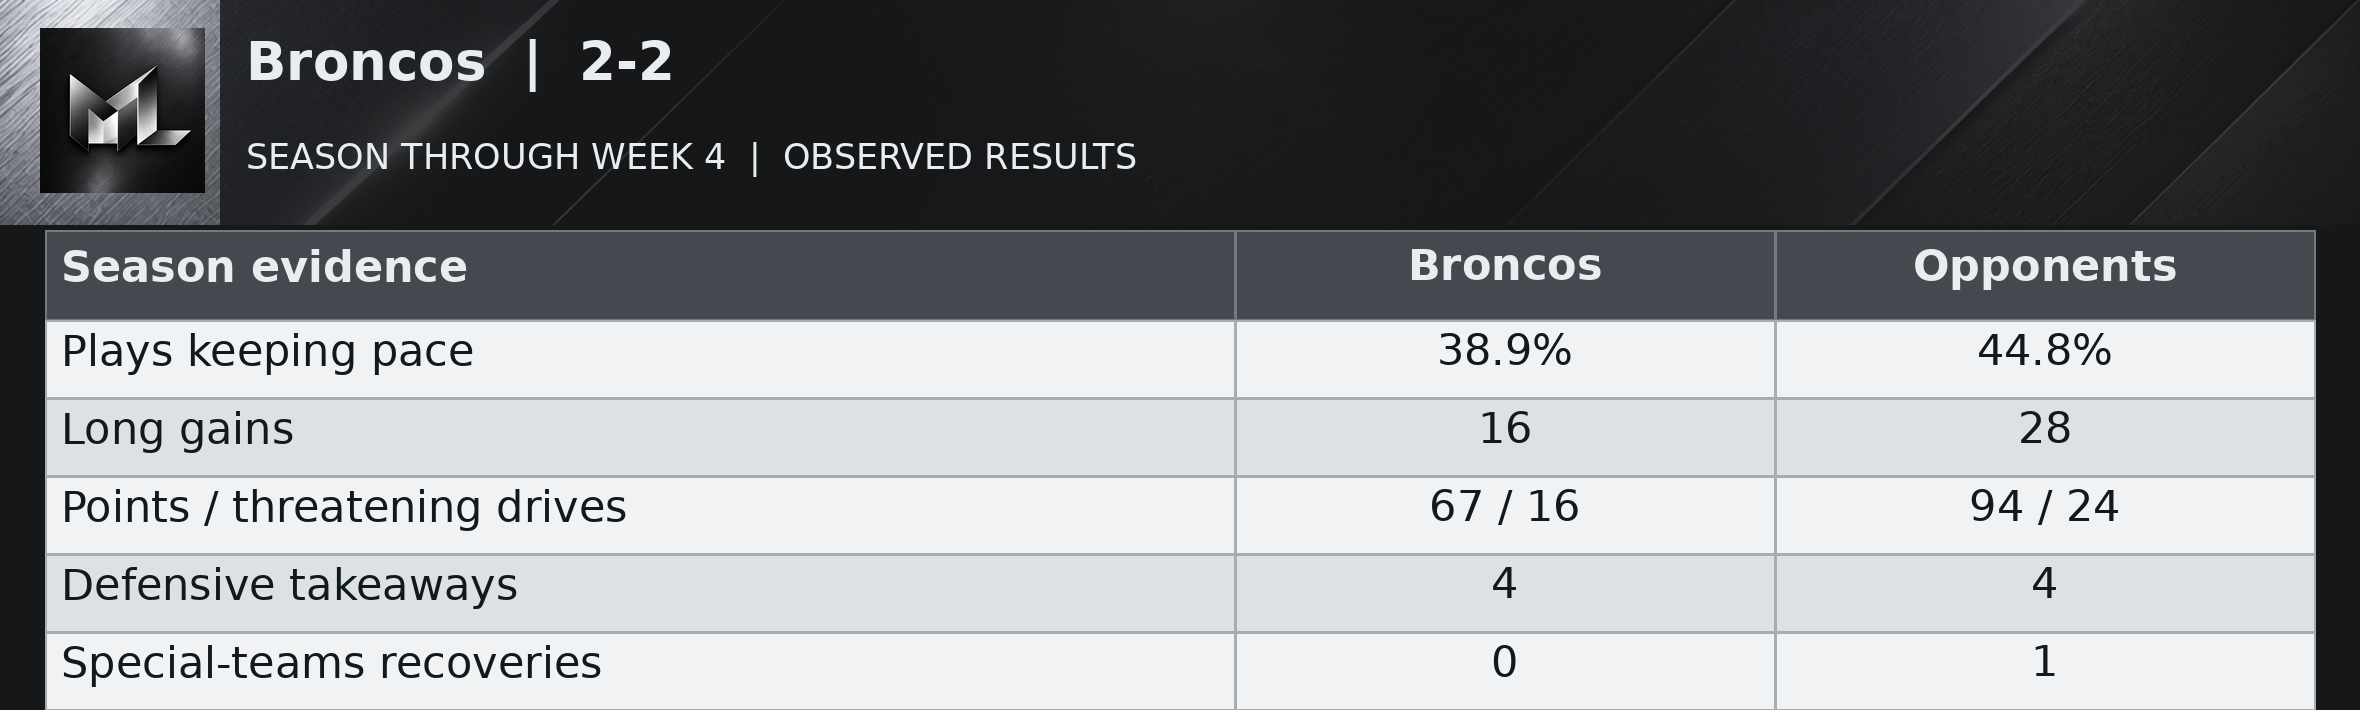
Broncos | 2-2
Read the table as text
| Season evidence | Broncos | Opponents |
|---|---|---|
| Plays keeping pace | 38.9% | 44.8% |
| Long gains | 16 | 28 |
| Points / threatening drives | 67 / 16 | 94 / 24 |
| Defensive takeaways | 4 | 4 |
| Special-teams recoveries | 0 | 1 |
Denver's offense has been inconsistent at finding long gains and consistently limited in the number of serious scoring chances it creates. Its weekly long gains have run one, nine, four and two. Across four games it has produced only 16 threatening possessions, against 24 for opponents. The defense has allowed 28 long gains while the offense has created 16. The two wins show that the Broncos can assemble enough offense; the losses show how little remains when the big gains shrink.
Sean Payton said “We just didn’t have enough offense”. Sunday's 24-14 defeat fits the full-season concern, with only two long gains and useful progress on 39.1 percent of plays. Marvin Mims Jr.'s muffed punt handed San Francisco its breakthrough touchdown possession. That was a special-teams giveaway and the only Denver giveaway Sunday, rather than evidence of an offensive interception habit. Four defensive takeaways over the season have not erased five team giveaways. At 2-2, Denver needs more possessions that threaten before it needs another late comeback.
After opponent punts or failed fourth downs, Broncos possessions have begun at their own 22.8, on average, across 16 competitive drives. The weekly average has varied widely, from their own 14.8 to their own 37.2. The latest game averaged their own 24.5. The resulting possession started at midfield or closer to the end zone in 1 of those 16 cases. These are actual starting spots, including punt returns, rather than a measure of the defense alone. The return unit has added 78 punt-return yards over the season. Pre-snap changes before the first run or pass affected 1 of these drives; those changes are excluded from the listed starting spots. Starts following turnovers are counted separately: 2 competitive possessions at their opponent 34.5 on average.
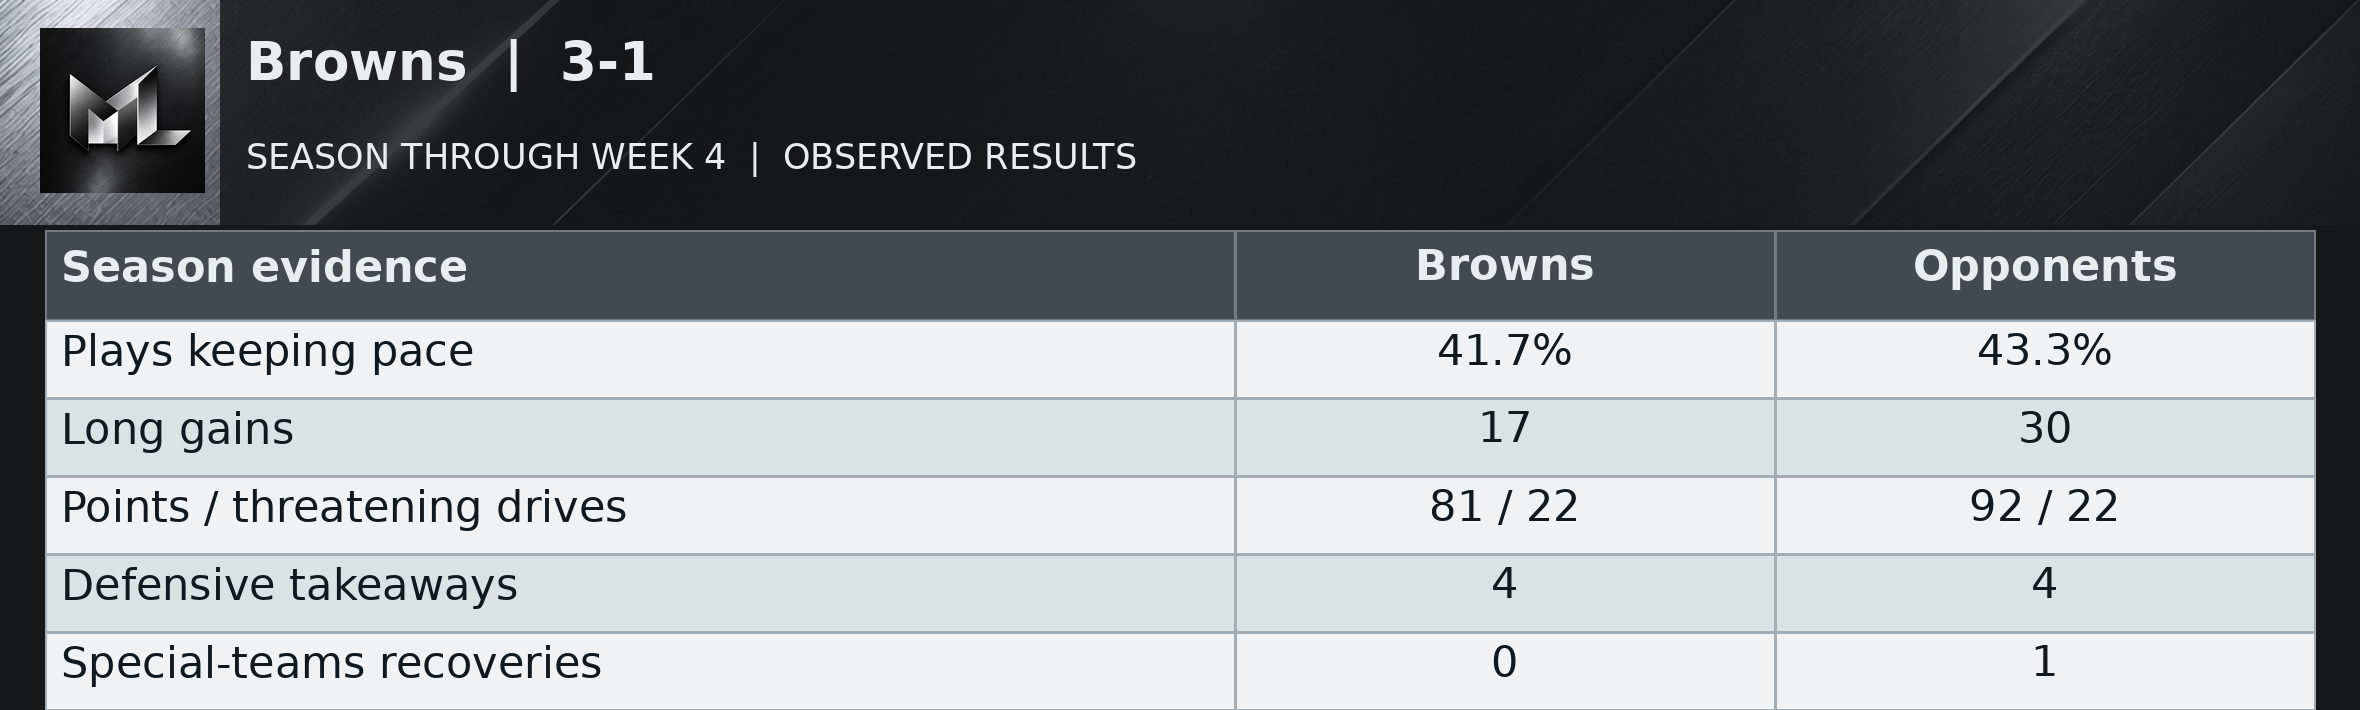
Browns | 3-1
Read the table as text
| Season evidence | Browns | Opponents |
|---|---|---|
| Plays keeping pace | 41.7% | 43.3% |
| Long gains | 17 | 30 |
| Points / threatening drives | 81 / 22 | 92 / 22 |
| Defensive takeaways | 4 | 4 |
| Special-teams recoveries | 0 | 1 |
Cleveland has won three straight close games while still showing a weaker whole-season balance than its 3-1 record. Its offense made useful gains on 42.9, 37.7 and 36.1 percent of plays before reaching 50.0 percent Thursday. That improvement is real, but a single stronger game does not erase the previous stalls. The Browns have allowed 30 long gains against 17 created, and opponents have taken 92 offensive points from 22 threatening drives against Cleveland's 81 from 22.
Todd Monken was “Not happy about the sack”. Deshaun Watson's late loss of yardage turned the finish into a 56-yard kick rather than an easier attempt. Andre Szmyt made it, but the operation still made its final job harder. The defense created two interceptions, one on Pittsburgh's last desperation throw, while Cleveland's own two giveaways included a return mistake. All four season takeaways were defensive. The comeback habit has value. Depending on a late kick every week leaves very little cushion for an ordinary error.
After opponent punts or failed fourth downs, Browns possessions have begun at their own 23.9, on average, across 17 competitive drives. The weekly average has varied widely, from their own 13.4 to their own 35.2. The latest game averaged their own 13.4. The resulting possession started at midfield or closer to the end zone in 3 of those 17 cases. These are actual starting spots, including punt returns, rather than a measure of the defense alone. The return unit has added 21 punt-return yards over the season. Pre-snap changes before the first run or pass affected 2 of these drives; those changes are excluded from the listed starting spots. Starts following turnovers are counted separately: 2 competitive possessions at their opponent 42.0 on average.
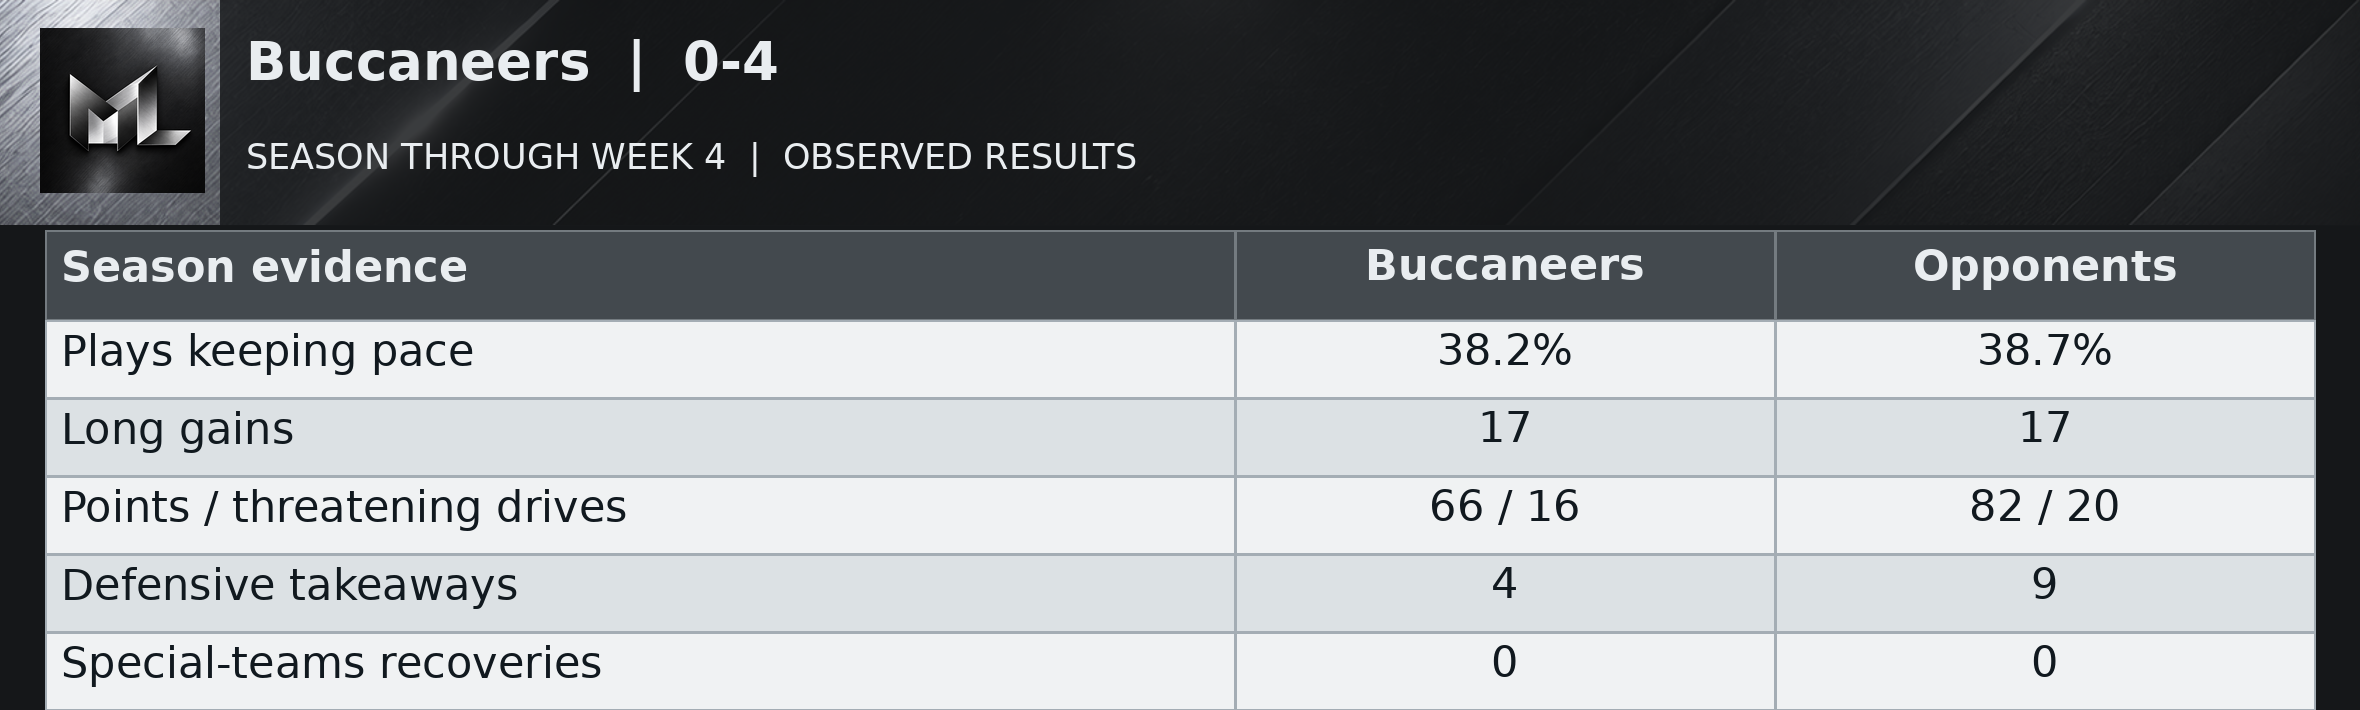
Buccaneers | 0-4
Read the table as text
| Season evidence | Buccaneers | Opponents |
|---|---|---|
| Plays keeping pace | 38.2% | 38.7% |
| Long gains | 17 | 17 |
| Points / threatening drives | 66 / 16 | 82 / 20 |
| Defensive takeaways | 4 | 9 |
| Special-teams recoveries | 0 | 0 |
Tampa Bay has repeatedly limited ordinary gains without receiving enough dependable offense in return. Across the season, its own useful-play share of 38.2 percent is almost identical to the 38.7 percent it allows. The problem is possession and opportunity: nine offensive giveaways against four defensive takeaways, with opponents producing 20 threatening drives against Tampa Bay's 16. The defense can keep scores manageable. It cannot make each offensive mistake free.
Sunday's 17-14 loss had more functional offense than Week 3, when only 21.9 percent of plays produced enough progress. The rebound to 45.9 percent came with just two threatening drives and another two giveaways. Tampa Bay scored touchdowns on both opportunities; reaching that territory only twice was the larger limitation. The weekly giveaway sequence of four, one, two and two makes carelessness a repeated concern. An 0-4 team that remains close has something to preserve, but close is becoming the most consistent part of the operation.
After opponent punts or failed fourth downs, Buccaneers possessions have begun at their own 29.8, on average, across 18 competitive drives. The weekly average has varied widely, from their own 23.0 to their own 35.8. The latest game averaged their own 23.0. The resulting possession started at midfield or closer to the end zone in 1 of those 18 cases. These are actual starting spots, including punt returns, rather than a measure of the defense alone. The return unit has added 80 punt-return yards over the season. Pre-snap changes before the first run or pass affected 1 of these drives; those changes are excluded from the listed starting spots. Starts following turnovers are counted separately: 3 competitive possessions at their own 32.3 on average.
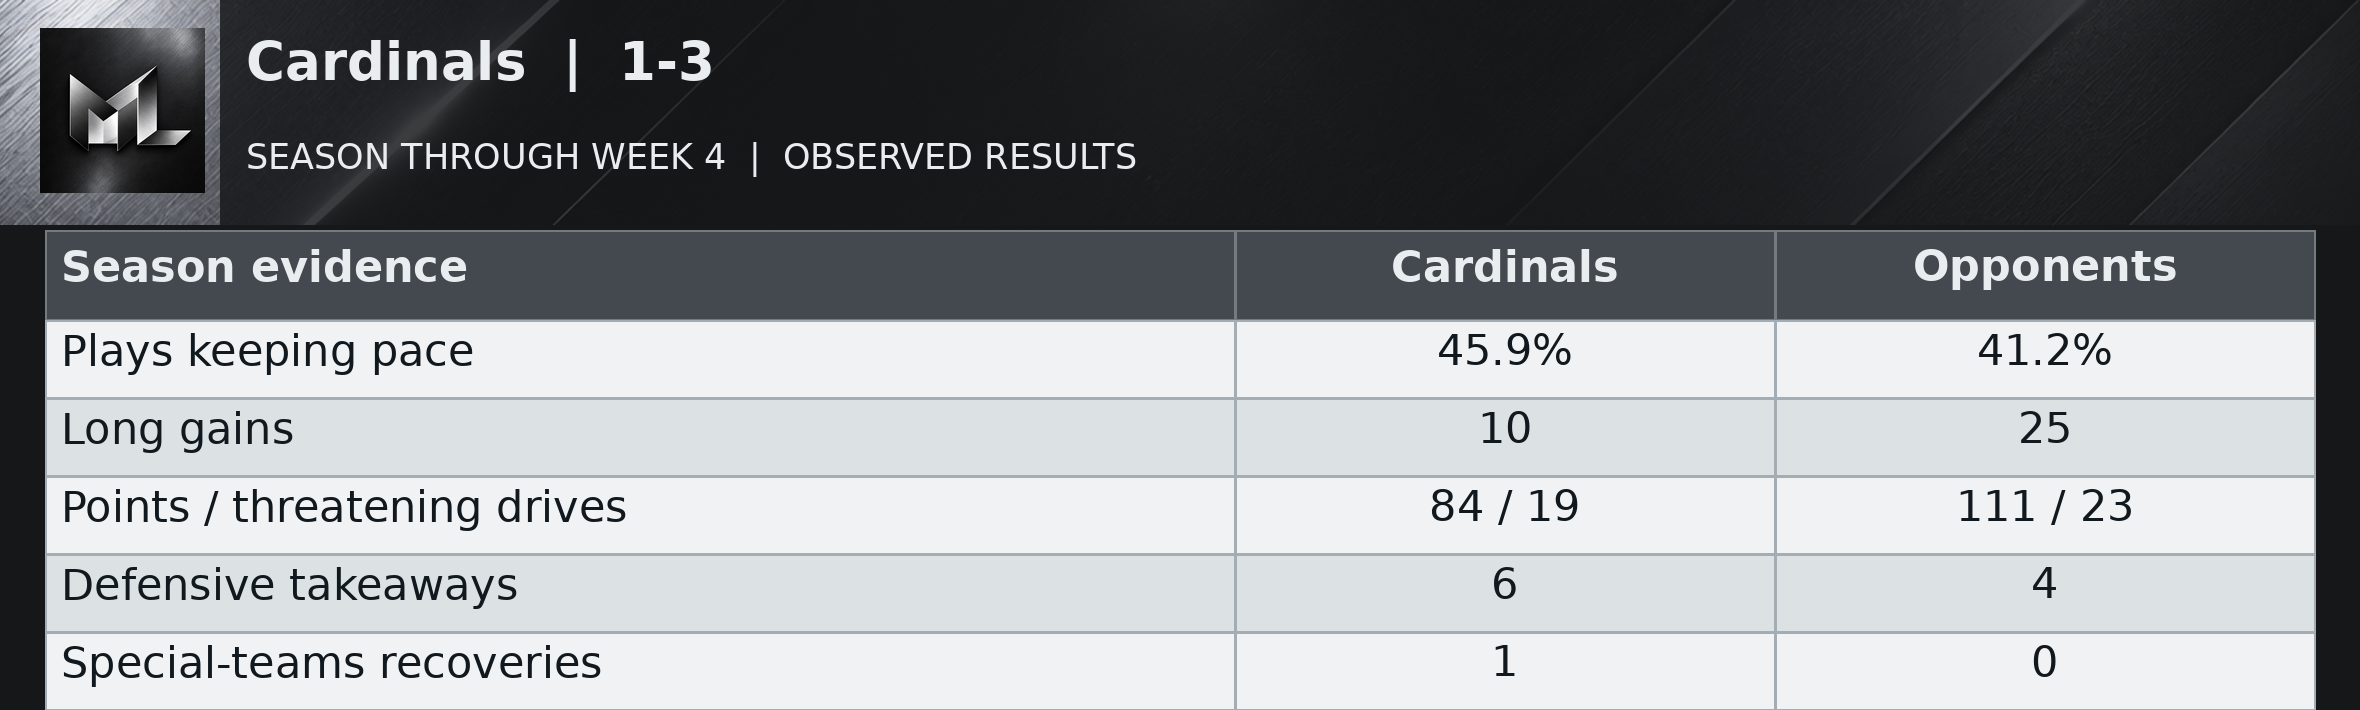
Cardinals | 1-3
Read the table as text
| Season evidence | Cardinals | Opponents |
|---|---|---|
| Plays keeping pace | 45.9% | 41.2% |
| Long gains | 10 | 25 |
| Points / threatening drives | 84 / 19 | 111 / 23 |
| Defensive takeaways | 6 | 4 |
| Special-teams recoveries | 1 | 0 |
Arizona can make ordinary progress, but it rarely shortens the job with a long gain. Its offense has produced only 10 long runs or passes across four games while allowing 25. The contrast has persisted even when the offense moved well: Week 3 contained no qualifying long gains despite a 53.8 percent share of useful plays. That makes repeated clean execution important, and the latest game supplied the opposite. Three giveaways interrupted a 36-24 loss after a 14-3 lead.
Jacoby Brissett said “you can’t have three interceptions”. That is the straightforward diagnosis for Sunday, though it should not be rewritten as four weeks of the same mistake. Arizona had only one giveaway in the first three games combined. Six of its seven takeaways were defensive, with one special-teams recovery. Opponents have collected 111 offensive points from 23 threatening drives compared with Arizona's 84 from 19. The Cardinals' 1-3 record reflects both insufficient quick offense and too little resistance once opponents arrive near scoring territory.
After opponent punts or failed fourth downs, Cardinals possessions have begun at their own 22.1, on average, across 13 competitive drives. The weekly average has varied widely, from their own 14.7 to their own 29.0. The latest game averaged their own 15.7. The resulting possession started at midfield or closer to the end zone in 1 of those 13 cases. These are actual starting spots, including punt returns, rather than a measure of the defense alone. The return unit has added 32 punt-return yards over the season. Starts following turnovers are counted separately: 7 competitive possessions at their own 41.1 on average.
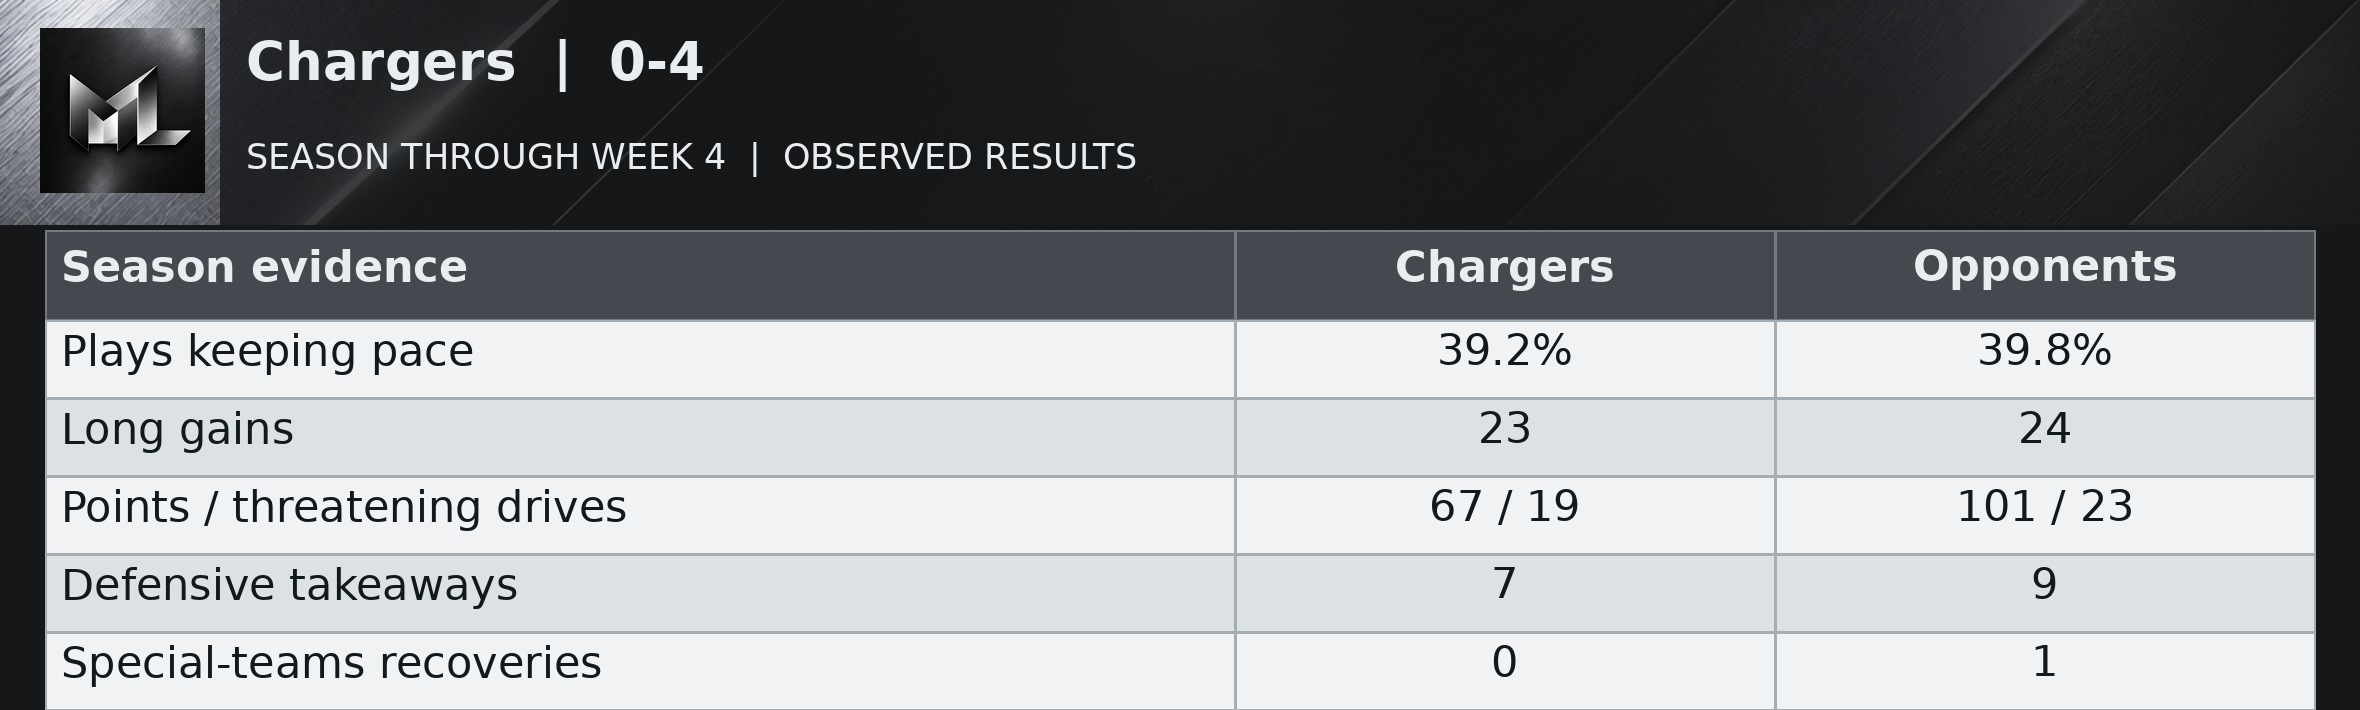
Chargers | 0-4
Read the table as text
| Season evidence | Chargers | Opponents |
|---|---|---|
| Plays keeping pace | 39.2% | 39.8% |
| Long gains | 23 | 24 |
| Points / threatening drives | 67 / 19 | 101 / 23 |
| Defensive takeaways | 7 | 9 |
| Special-teams recoveries | 0 | 1 |
The Chargers have allowed at least 24 points in every game and produced too few clean possessions to answer. Their offensive giveaways have run two, three, one and four. One of the 10 season giveaways came on special teams; the other nine did not. Seven defensive takeaways offered some help, but five came in a single game. The offense has kept moving on only 39.2 percent of plays and returned 67 points from 19 threatening drives, compared with 101 from 23 for opponents.
Jim Harbaugh praised a “never say die attitude”. Sunday supplied the comeback effort, from 27-6 down to a 30-23 final, and then the same ending problem: a sack-fumble on the final possession. Two interceptions, that fumble and a muffed punt gave Seattle four additional possessions. Seven long gains provided offensive life between stalls, but only 32.4 percent of plays made enough progress. Effort can narrow a score. Repeating possession mistakes is making 0-4 considerably easier to explain.
After opponent punts or failed fourth downs, Chargers possessions have begun at their own 16.8, on average, across 17 competitive drives. The weekly average has varied widely, from their own 13.4 to their own 29.0. The latest game averaged their own 18.3. The resulting possession started at midfield or closer to the end zone in 0 of those 17 cases. These are actual starting spots, including punt returns, rather than a measure of the defense alone. The return unit has added 14 punt-return yards over the season. Starts following turnovers are counted separately: 7 competitive possessions at their own 39.1 on average.
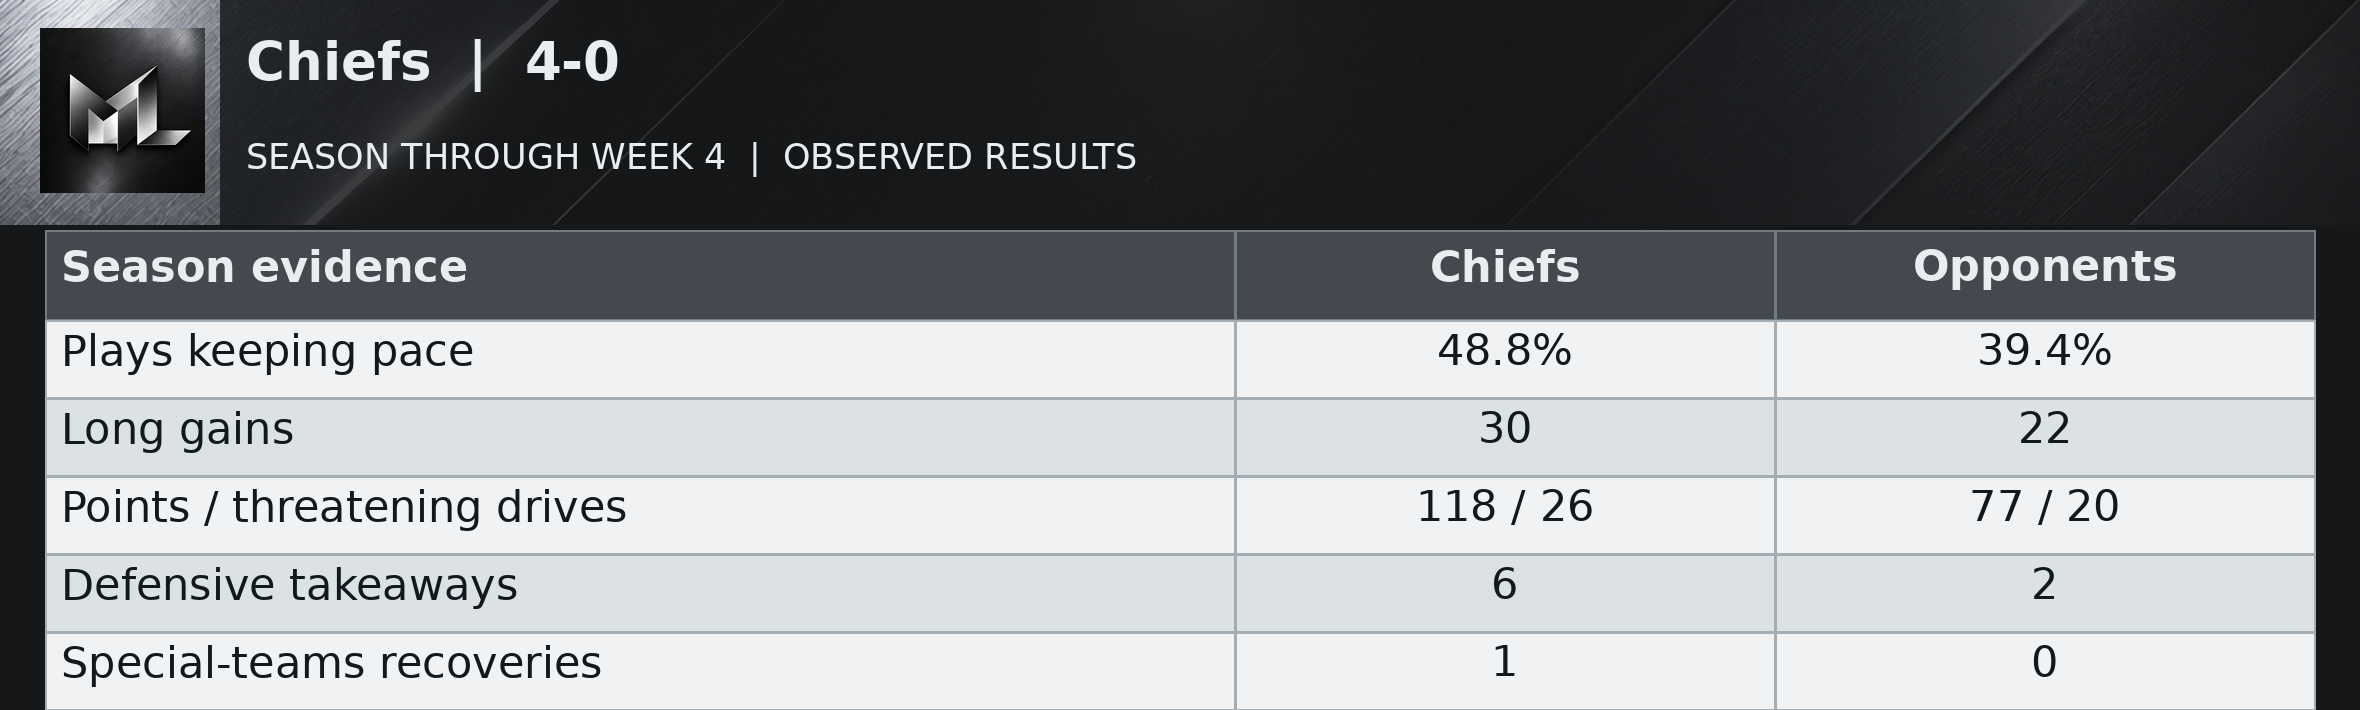
Chiefs | 4-0
Read the table as text
| Season evidence | Chiefs | Opponents |
|---|---|---|
| Plays keeping pace | 48.8% | 39.4% |
| Long gains | 30 | 22 |
| Points / threatening drives | 118 / 26 | 77 / 20 |
| Defensive takeaways | 6 | 2 |
| Special-teams recoveries | 1 | 0 |
Kansas City has been consistently productive near scoring territory and consistently careful with possession. Its four weekly returns were 31 points on six threatening drives, 33 on nine, 24 on six and 30 on five. Only two giveaways have interrupted that work. The defense has allowed opponents to stay on schedule on just 39.4 percent of their plays, a stronger foundation than the latest 30-27 score suggests. The offense itself has been less steady, alternating between sustained movement and heavier reliance on long gains.
Patrick Mahomes said “it’s not always going to be pretty”. Sunday's eight long gains made that an accurate description. Kenneth Walker's 76-yard run and Tyquan Thornton's 55-yard catch did substantial repair work. The late kickoff fumble gave Kansas City another scoring possession, but that recovery belongs to special teams. Six of the season's seven takeaways came outside special teams. The Chiefs earned their 4-0 start; the close games also show how quickly opponents can make the finish uncomfortable.
After opponent punts or failed fourth downs, Chiefs possessions have begun at their own 23.2, on average, across 17 competitive drives. The weekly average has varied widely, from their own 12.5 to their own 28.8. The latest game averaged their own 22.8. The resulting possession started at midfield or closer to the end zone in 2 of those 17 cases. These are actual starting spots, including punt returns, rather than a measure of the defense alone. The return unit has added 42 punt-return yards over the season. Starts following turnovers are counted separately: 6 competitive possessions at their opponent 38.2 on average.
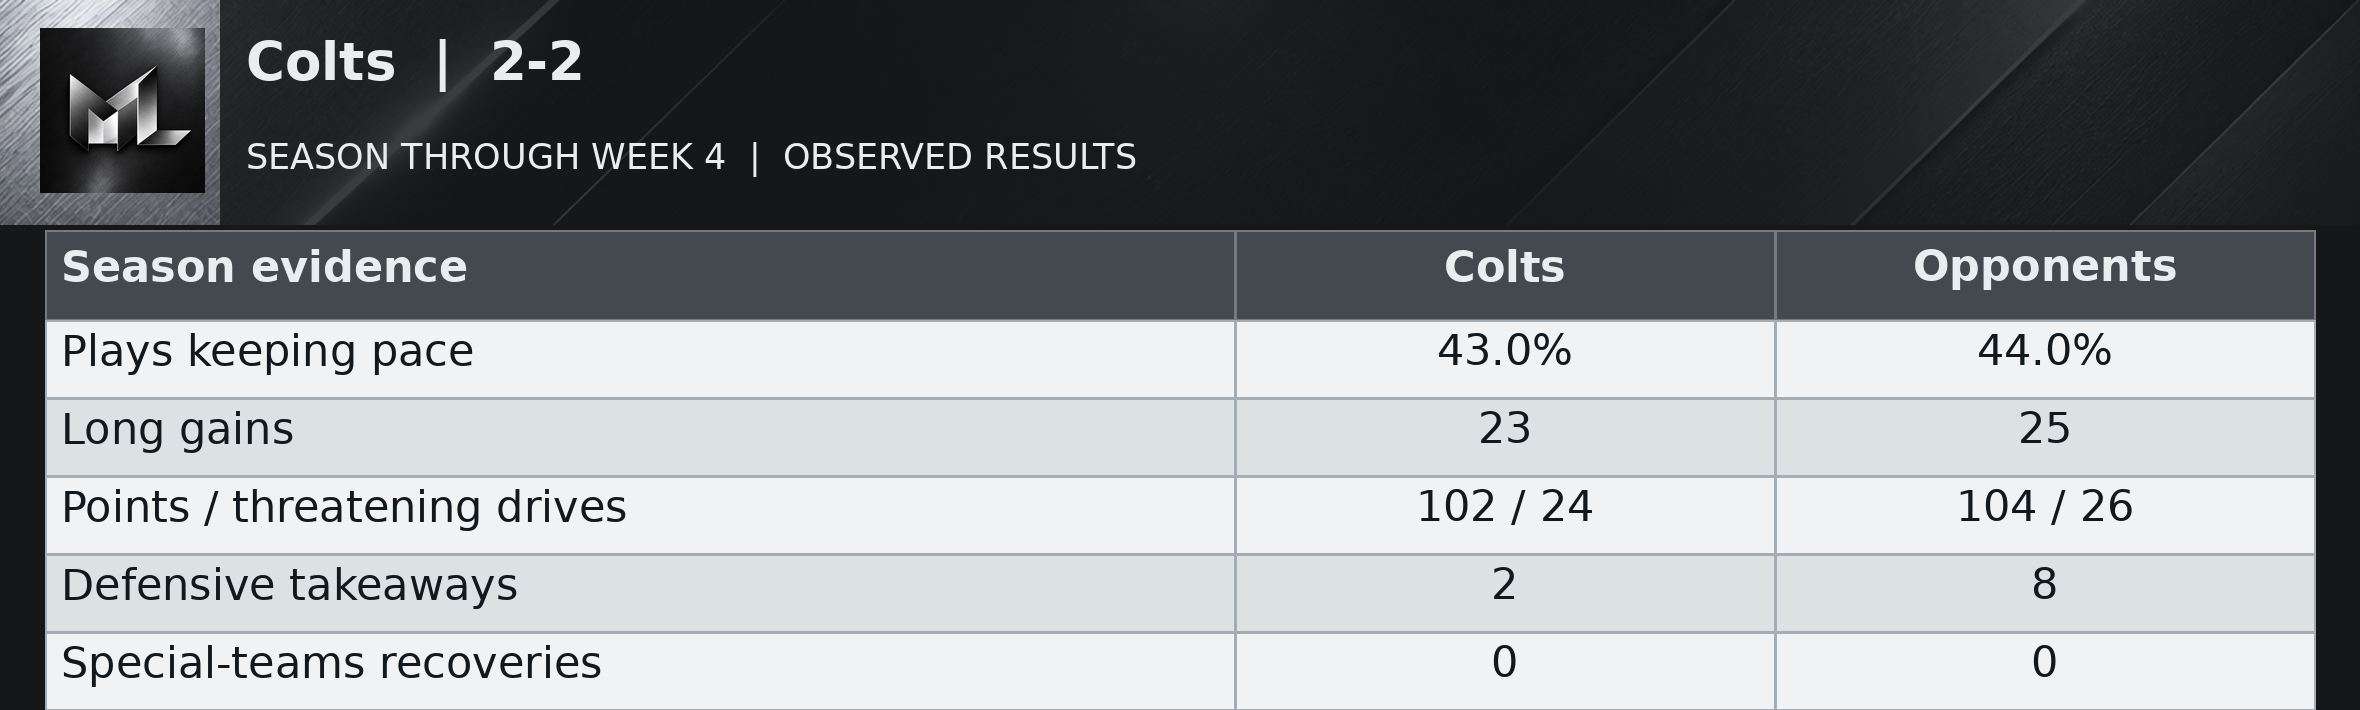
Colts | 2-2
Read the table as text
| Season evidence | Colts | Opponents |
|---|---|---|
| Plays keeping pace | 43.0% | 44.0% |
| Long gains | 23 | 25 |
| Points / threatening drives | 102 / 24 | 104 / 26 |
| Defensive takeaways | 2 | 8 |
| Special-teams recoveries | 0 | 0 |
Indianapolis has been fairly consistent at moving the ball and remarkably consistent at putting that movement at risk. Its weekly useful-play shares have stayed between 40.6 and 46.0 percent. Its giveaways have run two, one, three and two. The Colts have eight giveaways against just two defensive takeaways, meaning the two-game winning streak has not repaired their most repeated possession problem. Their defense has also allowed 104 offensive points from 26 threatening possessions, close to the offense's 102 from 24.
Daniel Jones said “Can’t afford to turn the ball over like that”. He had just won 30-13 while contributing both of Sunday's giveaways. The scoreboard does not repeal his statement. Jonathan Taylor's 95 rushing yards and two touchdowns helped restore order, and an interception handed Indianapolis a 20-yard touchdown possession. The other offensive work still mattered, especially the answer after Washington cut the lead to four. At 2-2, the Colts have evidence of resilience and very little evidence that the turnover problem has stopped.
After opponent punts or failed fourth downs, Colts possessions have begun at their own 26.4, on average, across 20 competitive drives. The weekly average has varied widely, from their own 10.2 to their own 36.1. The latest game averaged their own 36.1. The resulting possession started at midfield or closer to the end zone in 2 of those 20 cases. These are actual starting spots, including punt returns, rather than a measure of the defense alone. The return unit has added 25 punt-return yards over the season. Starts following turnovers are counted separately: 2 competitive possessions at their opponent 17.5 on average.
Commanders | 1-3
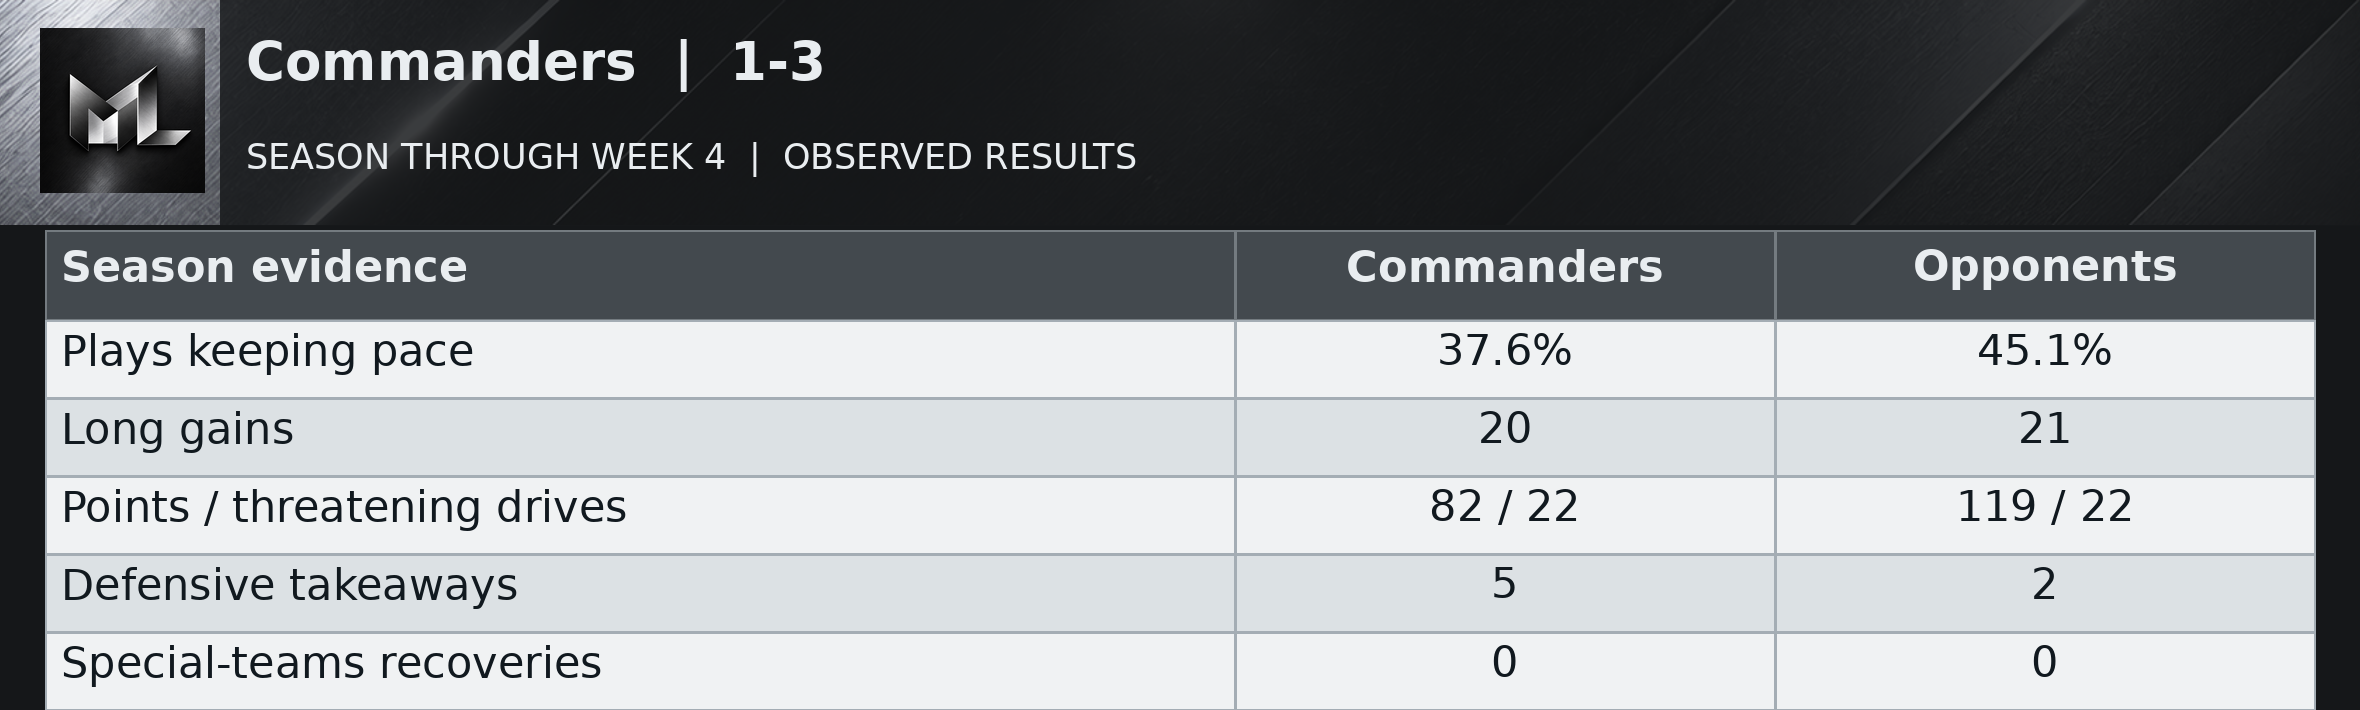
Read the table as text
| Season evidence | Commanders | Opponents |
|---|---|---|
| Plays keeping pace | 37.6% | 45.1% |
| Long gains | 20 | 21 |
| Points / threatening drives | 82 / 22 | 119 / 22 |
| Defensive takeaways | 5 | 2 |
| Special-teams recoveries | 0 | 0 |
Washington's offense has become less dependable as its quarterback options have narrowed, but the season's defensive weakness is also substantial. Opponents have returned 119 offensive points from 22 threatening drives, compared with Washington's 82 from the same number. The offense's useful-play share has varied from 26.2 to 52.2 percent. Its five defensive takeaways all came in the last two games, and its own two giveaways have been rare. Protecting the ball has not supplied enough sustained progress.
Sunday's 30-13 loss made the distinction clear. Two early trips near the goal line ended in field goals, and two Indianapolis giveaways did not become a durable lead. After Marcus Mariota left injured, Athan Kaliakmanis supplied a 47-yard touchdown and a 48-yard completion. The offense still made useful gains on only 26.2 percent of its plays. Those two throws supplied 95 of his 186 passing yards. Washington can find a spectacular answer without finding the routine answer. At 1-3, it needs much more of the latter.
After opponent punts or failed fourth downs, Commanders possessions have begun at their own 21.9, on average, across 17 competitive drives. The weekly average has varied widely, from their own 15.2 to their own 35.0. The latest game averaged their own 15.2. The resulting possession started at midfield or closer to the end zone in 0 of those 17 cases. These are actual starting spots, including punt returns, rather than a measure of the defense alone. The return unit has added 84 punt-return yards over the season. Pre-snap changes before the first run or pass affected 1 of these drives; those changes are excluded from the listed starting spots. Starts following turnovers are counted separately: 4 competitive possessions at their opponent 37.0 on average.
Cowboys | 2-2
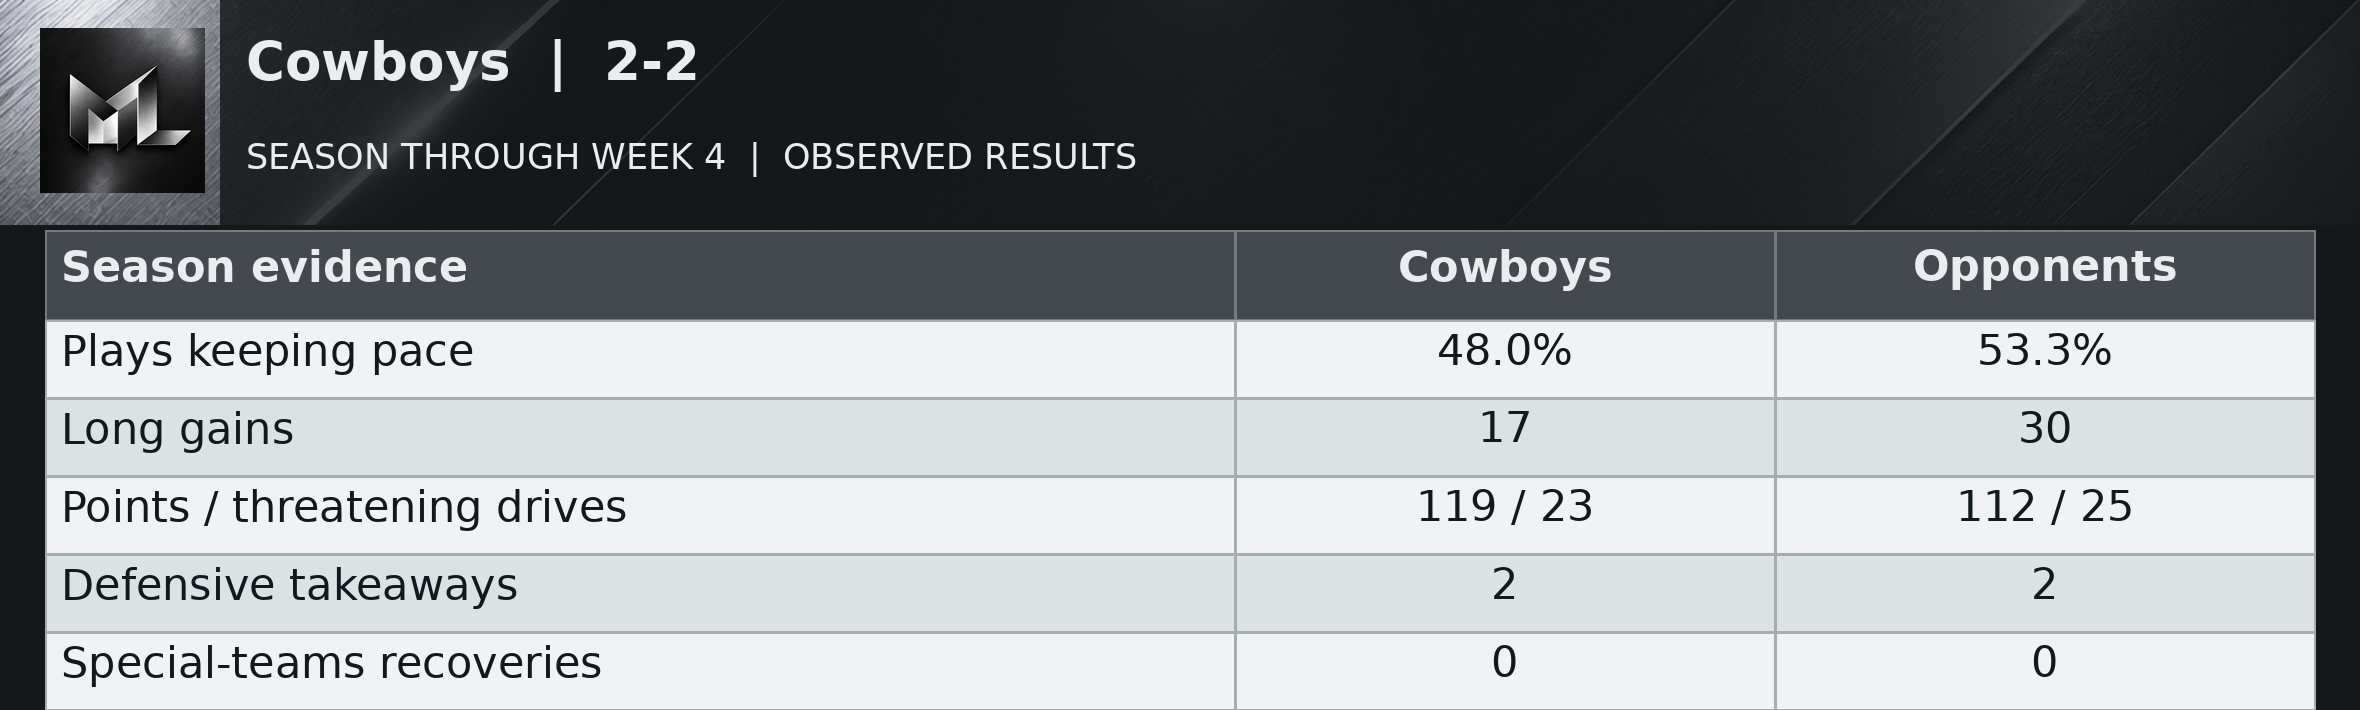
Read the table as text
| Season evidence | Cowboys | Opponents |
|---|---|---|
| Plays keeping pace | 48.0% | 53.3% |
| Long gains | 17 | 30 |
| Points / threatening drives | 119 / 23 | 112 / 25 |
| Defensive takeaways | 2 | 2 |
| Special-teams recoveries | 0 | 0 |
Dallas has a relatively dependable offense and a defense that repeatedly gives the work back. Its useful offensive gains have stayed between 45.1 and 53.7 percent across four games, while the defense has allowed 53.3 percent over the season. The offense has returned 119 points from 23 threatening drives. Opponents have generated 25 such possessions and 30 long gains against Dallas's 17. Only two defensive takeaways have interrupted that flow. Two giveaways of its own are a strength, but protecting possession cannot prevent someone else from scoring.
Brian Schottenheimer said CeeDee Lamb “put on a show”. Seventeen catches for 189 yards, capped by the winning touchdown in the 34-30 comeback, support the praise. They also explain why Dallas needed such a show. The Cowboys gave nothing away, yet still required an 11-play, 74-yard final touchdown drive. Defensive pass-interference and holding penalties helped an earlier goal-line possession stay alive; those were assistance from Houston, not proof of effortless execution. The 2-2 record is balanced. The weekly burden on the offense is not.
After opponent punts or failed fourth downs, Cowboys possessions have begun at their own 30.2, on average, across 11 competitive drives. The weekly average has varied widely, from their own 15.0 to their own 36.0. The latest game averaged their own 29.2. The resulting possession started at midfield or closer to the end zone in 1 of those 11 cases. These are actual starting spots, including punt returns, rather than a measure of the defense alone. The return unit has added 90 punt-return yards over the season. Starts following turnovers are counted separately: 2 competitive possessions at their opponent 48.5 on average.
Dolphins | 0-4
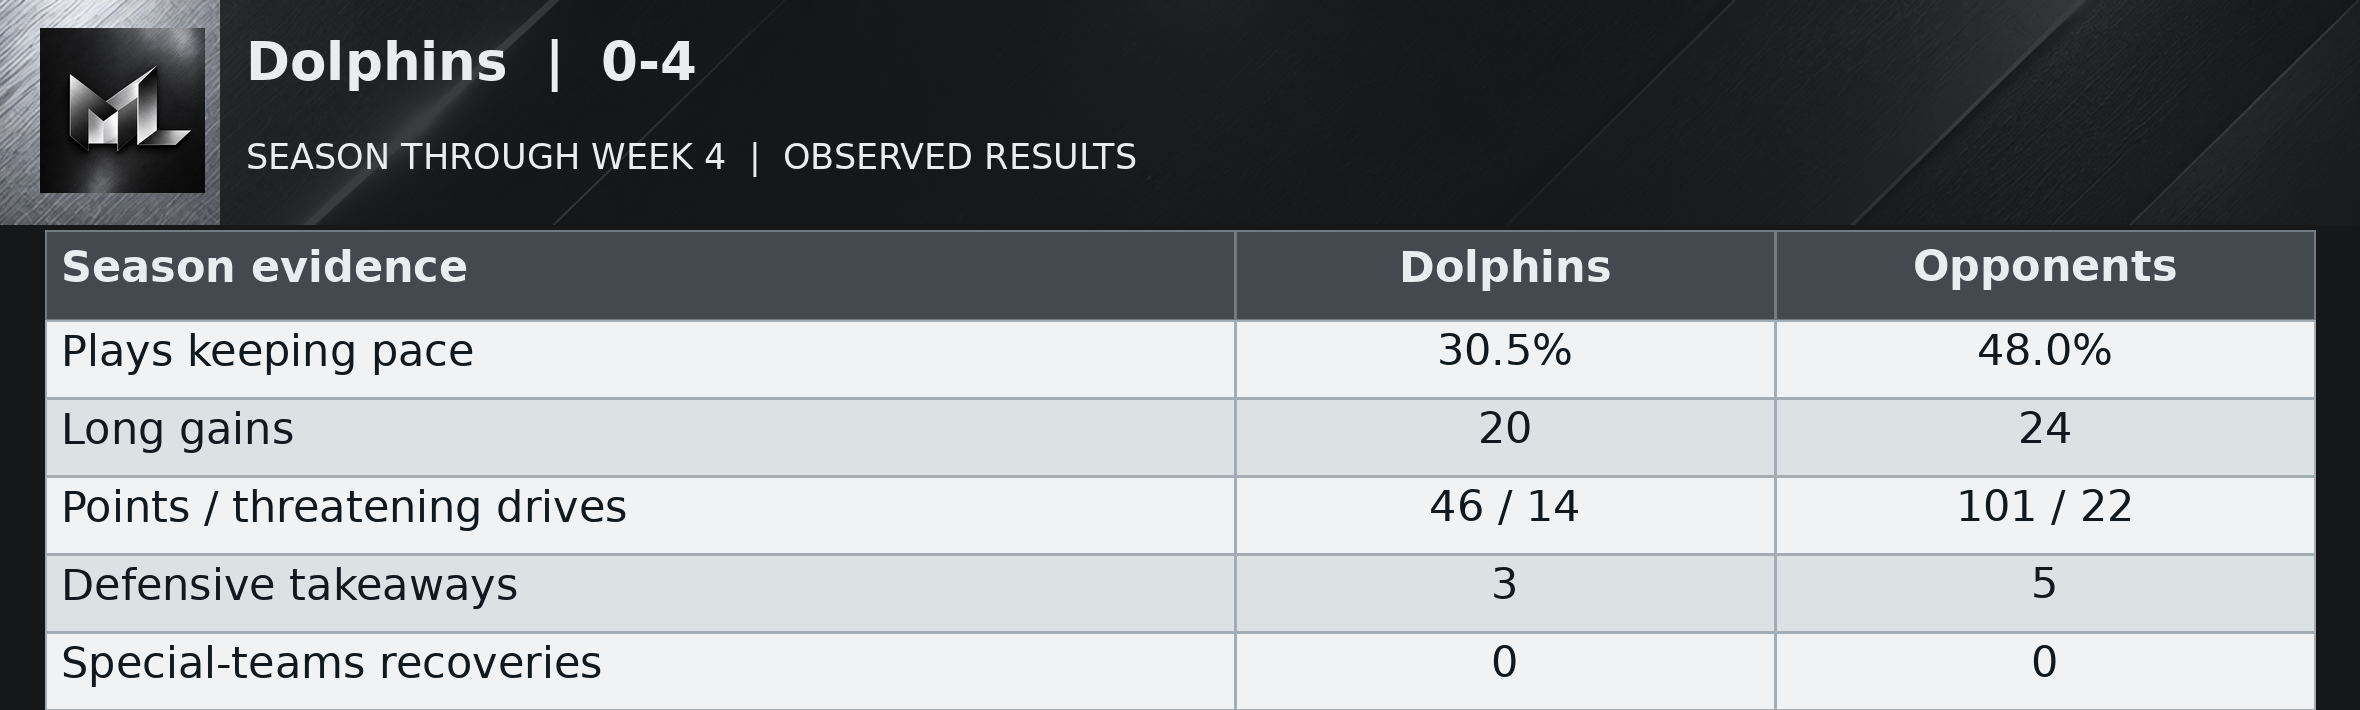
Read the table as text
| Season evidence | Dolphins | Opponents |
|---|---|---|
| Plays keeping pace | 30.5% | 48.0% |
| Long gains | 20 | 24 |
| Points / threatening drives | 46 / 14 | 101 / 22 |
| Defensive takeaways | 3 | 5 |
| Special-teams recoveries | 0 | 0 |
Miami has been the most consistently unsuccessful offense in this season window. Its weekly useful-play shares have stayed in a narrow band from 27.0 to 32.0 percent. That consistency is a problem, not reassurance. Scores of 13, 13, 10 and 10 show the same limitation from another angle. The offense has generated only 14 threatening drives and 46 points from them, while opponents have created 22 and returned 101. Its 20 long gains have not become a regular supply of completed scoring possessions.
Malik Willis said “we’re going out there and competing”. Sunday's 15-10 loss was closer than the previous defeats, but the offense reached threatening territory only twice and lost a fumble. A 53-yard run supplied a shortcut to one scoring chance; the ordinary progress remained weakest in the league's season window. Four sacks were welcome after none in the first three games, though a defense allowing useful gains on 48.0 percent of season plays has more to prove. Competition has become visible. Sustained offense has not.
After opponent punts or failed fourth downs, Dolphins possessions have begun at their own 20.2, on average, across 11 competitive drives. The weekly average has varied widely, from their own 15.3 to their own 27.2. The latest game averaged their own 27.2. The resulting possession started at midfield or closer to the end zone in 0 of those 11 cases. These are actual starting spots, including punt returns, rather than a measure of the defense alone. The return unit has added 24 punt-return yards over the season. Pre-snap changes before the first run or pass affected 1 of these drives; those changes are excluded from the listed starting spots. Starts following turnovers are counted separately: 3 competitive possessions at their opponent 49.7 on average.
Eagles | 2-2
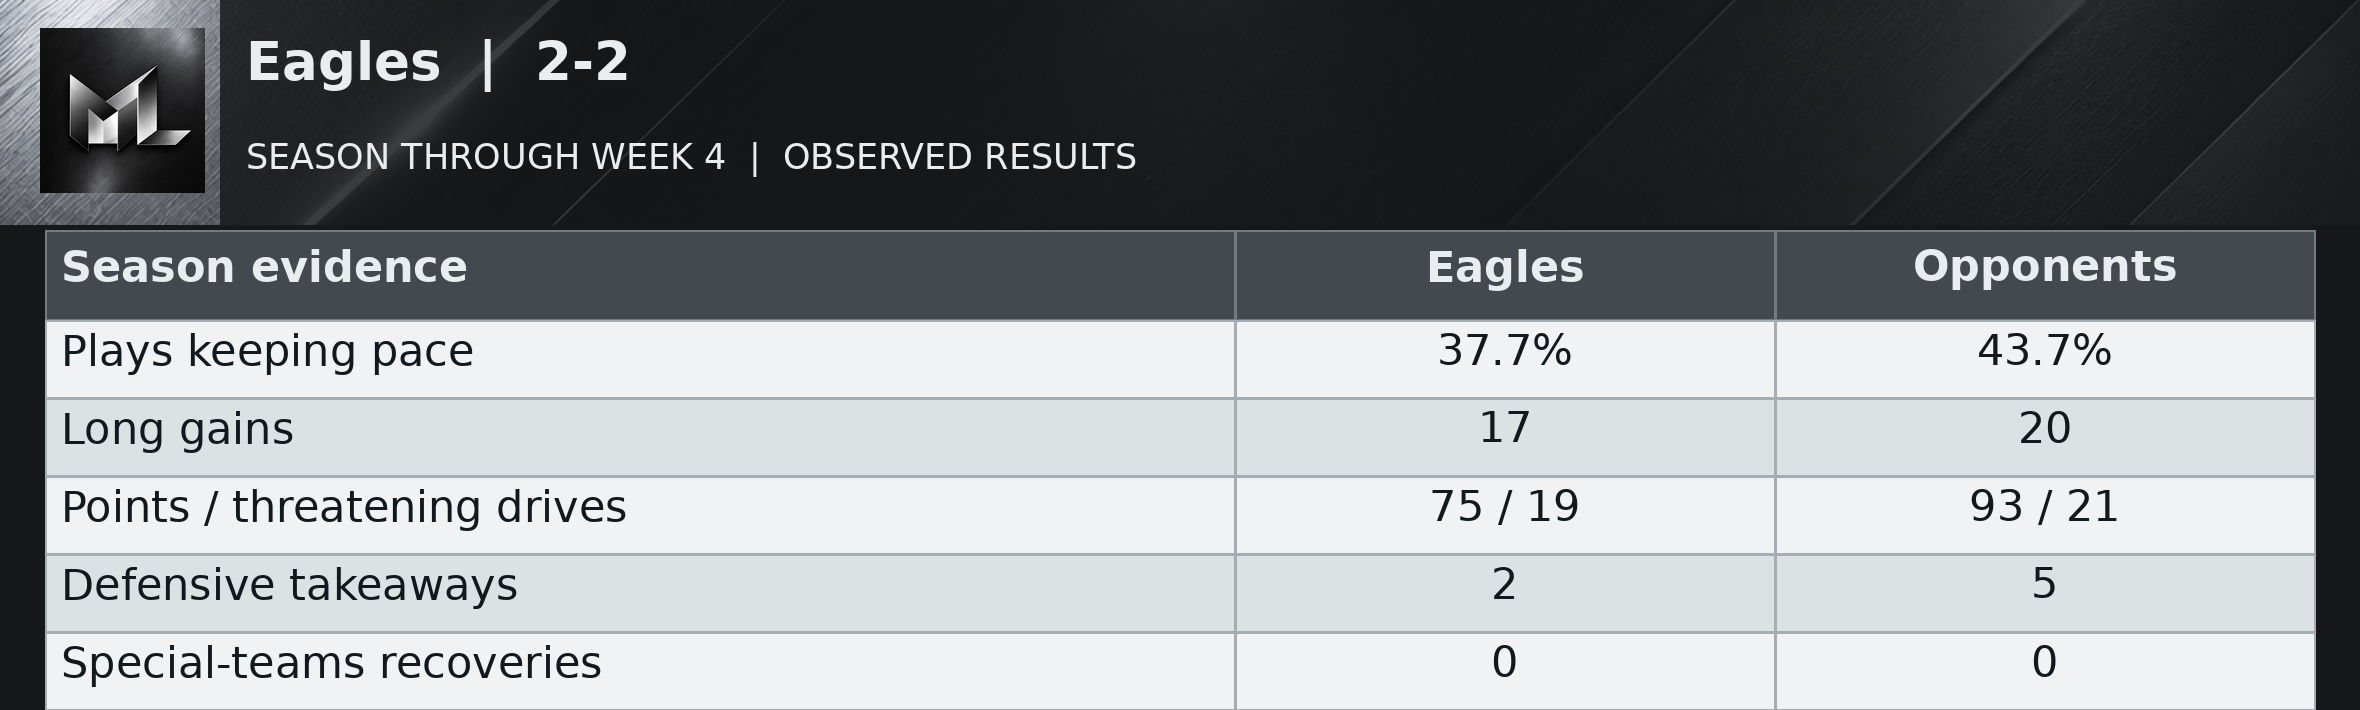
Read the table as text
| Season evidence | Eagles | Opponents |
|---|---|---|
| Plays keeping pace | 37.7% | 43.7% |
| Long gains | 17 | 20 |
| Points / threatening drives | 75 / 19 | 93 / 21 |
| Defensive takeaways | 2 | 5 |
| Special-teams recoveries | 0 | 0 |
Philadelphia's offense has been unreliable throughout a 2-2 start, keeping up with the down on only 37.7 percent of plays. Its useful-play share actually rose in the Week 3 loss before collapsing to 31.0 percent Sunday, a reminder that moving the ball and cashing in are separate questions. Five giveaways in Weeks 2 and 3 created another problem, but Sunday was clean. The defense finally collected its first two takeaways, yet the team still lost 24-20.
Jalen Hurts called it “Poor execution”. Zero third-down conversions in 12 attempts and 172 total yards leave little to dispute. Two interceptions set up 10 first-half points, but the offense then failed to protect a 10-point lead. The decision to reject a short field goal on fourth down removed a chance to make it a 13-point margin and handed the Rams a possession that became a 98-yard touchdown march. A defense can provide territory and chances. Philadelphia still has to use them.
After opponent punts or failed fourth downs, Eagles possessions have begun at their own 30.1, on average, across 18 competitive drives. The weekly average has varied widely, from their own 17.7 to their own 38.0. The latest game averaged their own 38.0. The resulting possession started at midfield or closer to the end zone in 1 of those 18 cases. These are actual starting spots, including punt returns, rather than a measure of the defense alone. The return unit has added 136 punt-return yards over the season. Pre-snap changes before the first run or pass affected 2 of these drives; those changes are excluded from the listed starting spots. Starts following turnovers are counted separately: 2 competitive possessions at their opponent 31.5 on average.
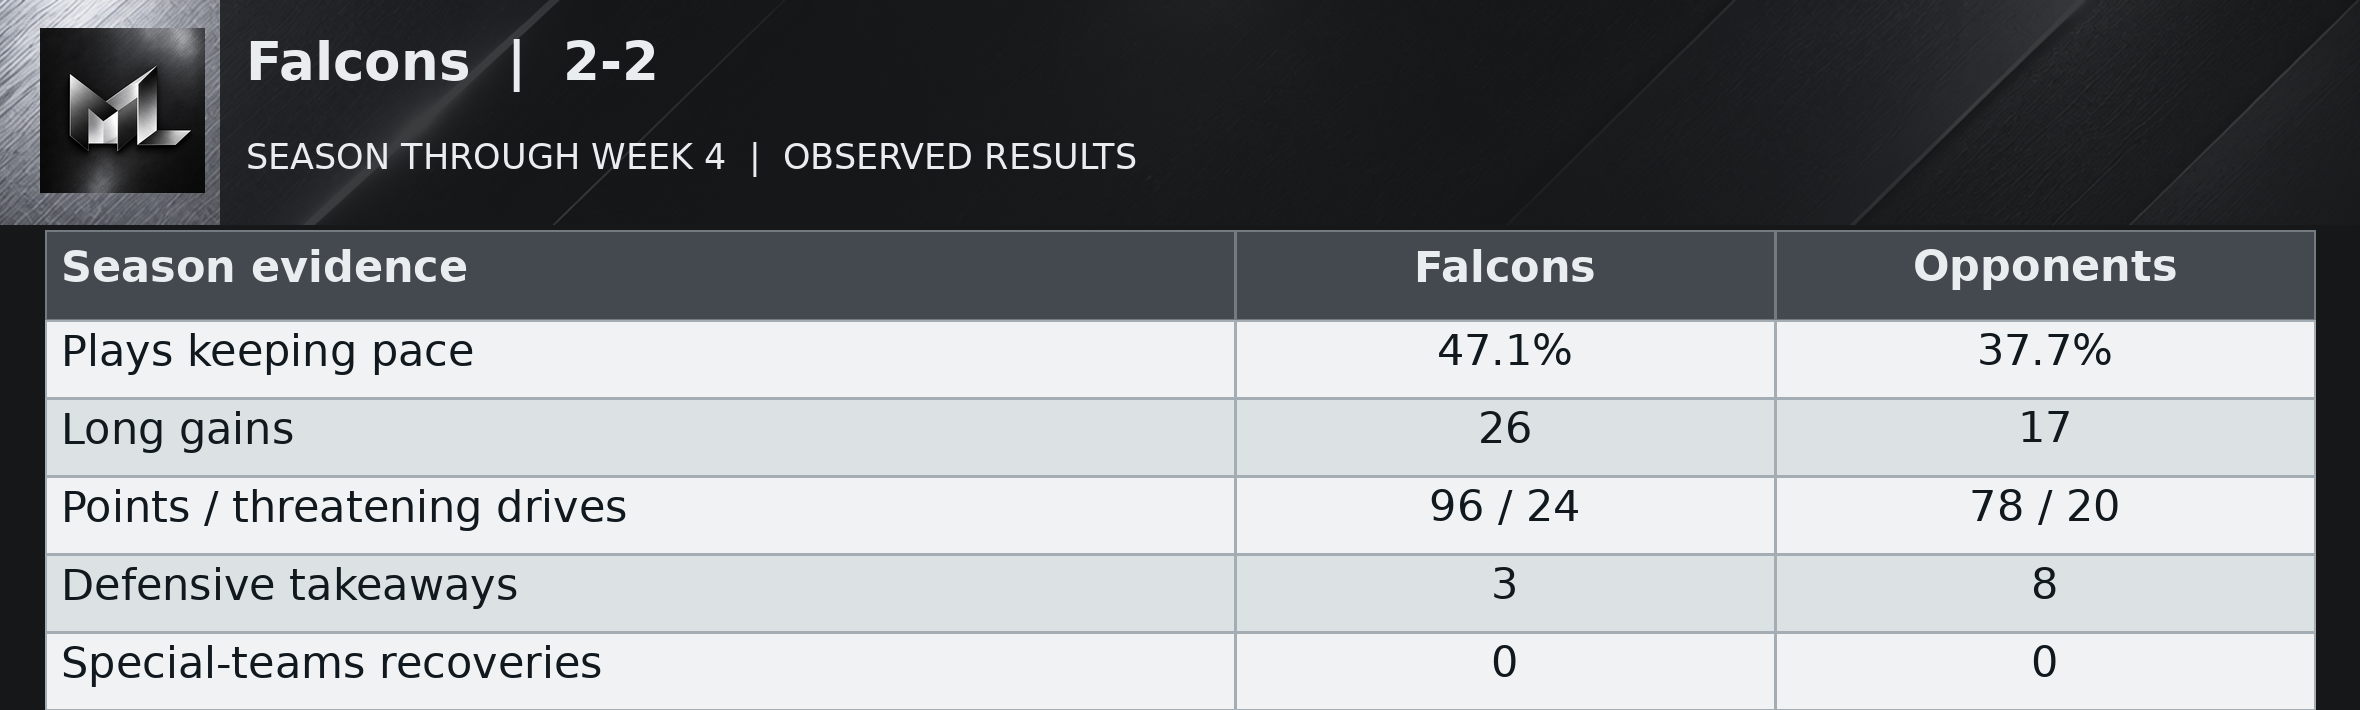
Falcons | 2-2
Read the table as text
| Season evidence | Falcons | Opponents |
|---|---|---|
| Plays keeping pace | 47.1% | 37.7% |
| Long gains | 26 | 17 |
| Points / threatening drives | 96 / 24 | 78 / 20 |
| Defensive takeaways | 3 | 8 |
| Special-teams recoveries | 0 | 0 |
Atlanta's season divides cleanly into two halves. Its offense kept moving on only 36.8 and 34.3 percent of plays in the first two games, then 59.4 and 59.3 percent in the last two. The scores followed: 16 combined points became 80. Michael Penix Jr.'s return coincides with that improvement, but two excellent games are still a change in direction rather than proof of four-game consistency. The defense's season record is stronger, allowing useful gains on 37.7 percent of plays.
Kevin Stefanski said Penix “took care of the football”. Monday's clean game supports the claim, as do Atlanta's one giveaway across the two wins compared with seven across the two losses. The Falcons ran for 205 yards while allowing New Orleans only 50 and scored 45 points on eight threatening possessions. That was production beyond the early short-field touchdown following Kendre Miller's fumble. The remaining concern is whether the cleaner offense persists when it loses Monday's comfortable starting positions. The early disasters still count, even after the fun returns.
After opponent punts or failed fourth downs, Falcons possessions have begun at their own 25.2, on average, across 21 competitive drives. The weekly average has varied widely, from their own 16.2 to their own 37.5. The latest game averaged their own 37.5. The resulting possession started at midfield or closer to the end zone in 2 of those 21 cases. These are actual starting spots, including punt returns, rather than a measure of the defense alone. The return unit has added 87 punt-return yards over the season. Pre-snap changes before the first run or pass affected 2 of these drives; those changes are excluded from the listed starting spots. Starts following turnovers are counted separately: 2 competitive possessions at their opponent 23.5 on average.
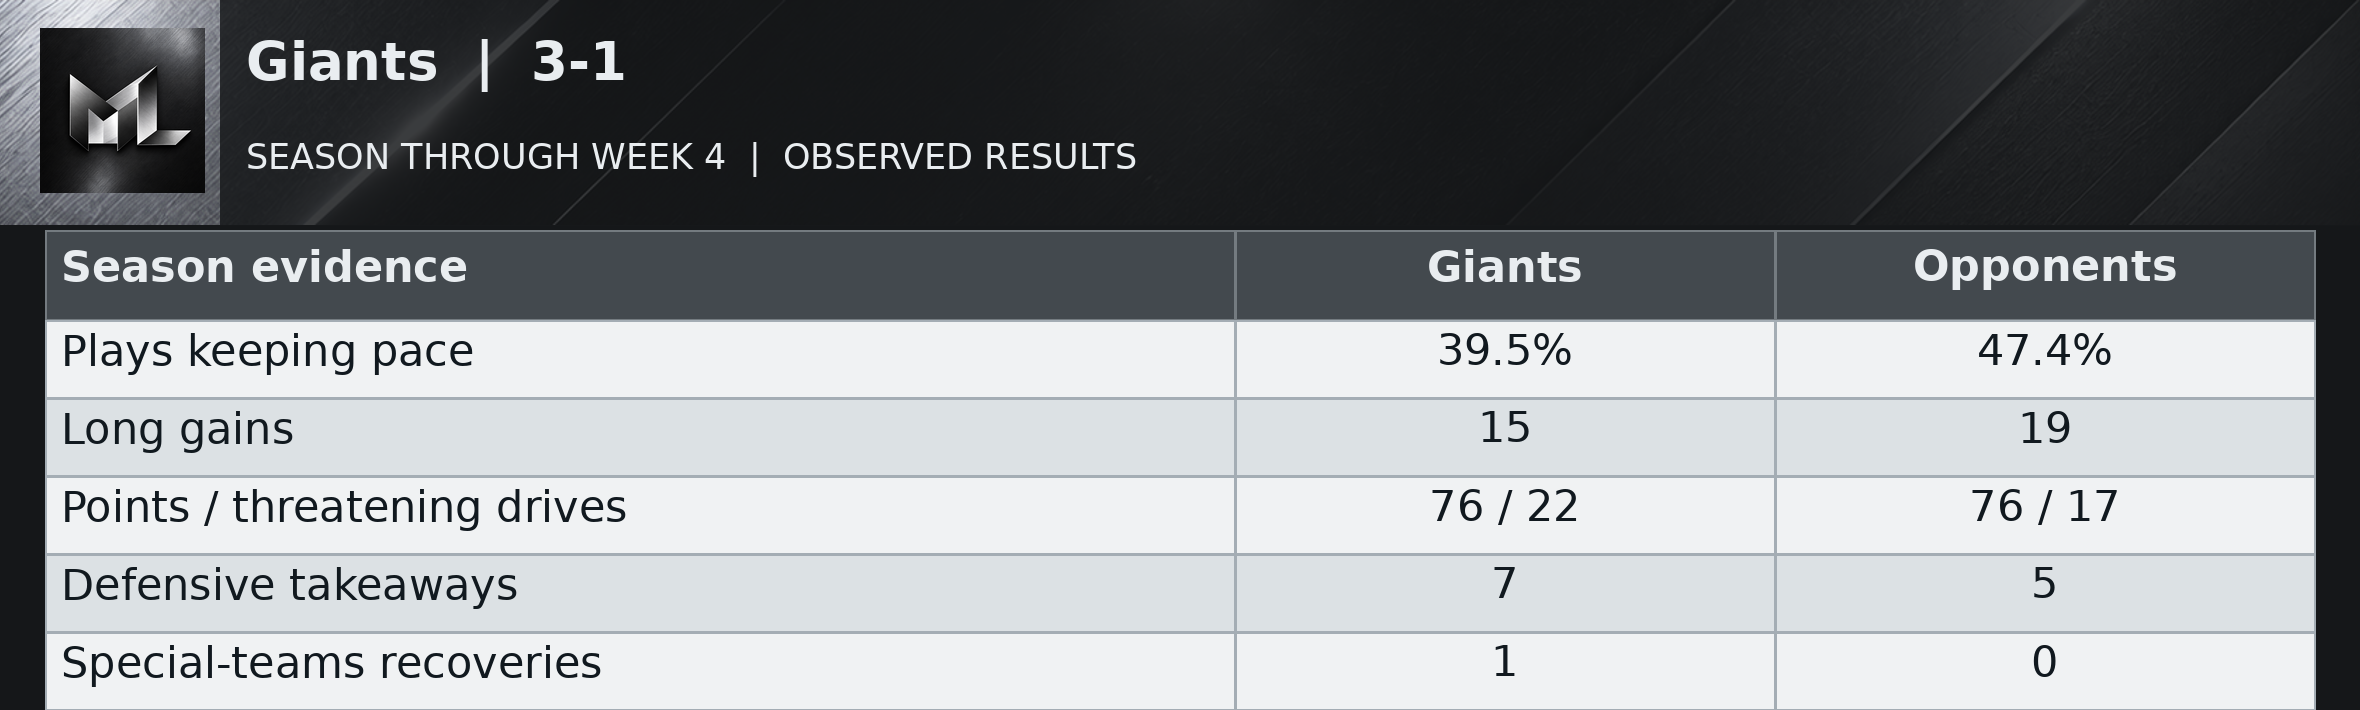
Giants | 3-1
Read the table as text
| Season evidence | Giants | Opponents |
|---|---|---|
| Plays keeping pace | 39.5% | 47.4% |
| Long gains | 15 | 19 |
| Points / threatening drives | 76 / 22 | 76 / 17 |
| Defensive takeaways | 7 | 5 |
| Special-teams recoveries | 1 | 0 |
The Giants' 3-1 record sits beside a much shakier offensive season. Their useful-play share fell from 60.0 percent in the opener to 27.3, 36.8 and 31.1. The offense scored six and 12 in the middle two games before producing 30 Sunday, with a defensive touchdown raising the latest scoreboard to 36. Seven of eight season takeaways were defensive. That repeated ability to steal possession has mattered more than the offense's ordinary movement, while five giveaways have complicated the benefit.
John Harbaugh called Sunday “a winning game”. Correct, and incomplete as a diagnosis. The 36-24 result included a 98-yard interception return that sealed the outcome, three interceptions collected overall and three giveaways by New York. A defensive score does not mean the offense finished another drive. The Giants also allowed Arizona two long early touchdown marches before tightening. Finding ways to win is useful. An offense that has struggled between isolated scoring plays for three straight weeks needs more than the record as its defense.
After opponent punts or failed fourth downs, Giants possessions have begun at their own 25.5, on average, across 17 competitive drives. The weekly average has varied widely, from their own 14.0 to their own 35.7. The latest game averaged their own 35.7. The resulting possession started at midfield or closer to the end zone in 1 of those 17 cases. These are actual starting spots, including punt returns, rather than a measure of the defense alone. The return unit has added 41 punt-return yards over the season. Pre-snap changes before the first run or pass affected 2 of these drives; those changes are excluded from the listed starting spots. Starts following turnovers are counted separately: 6 competitive possessions at their opponent 44.7 on average.
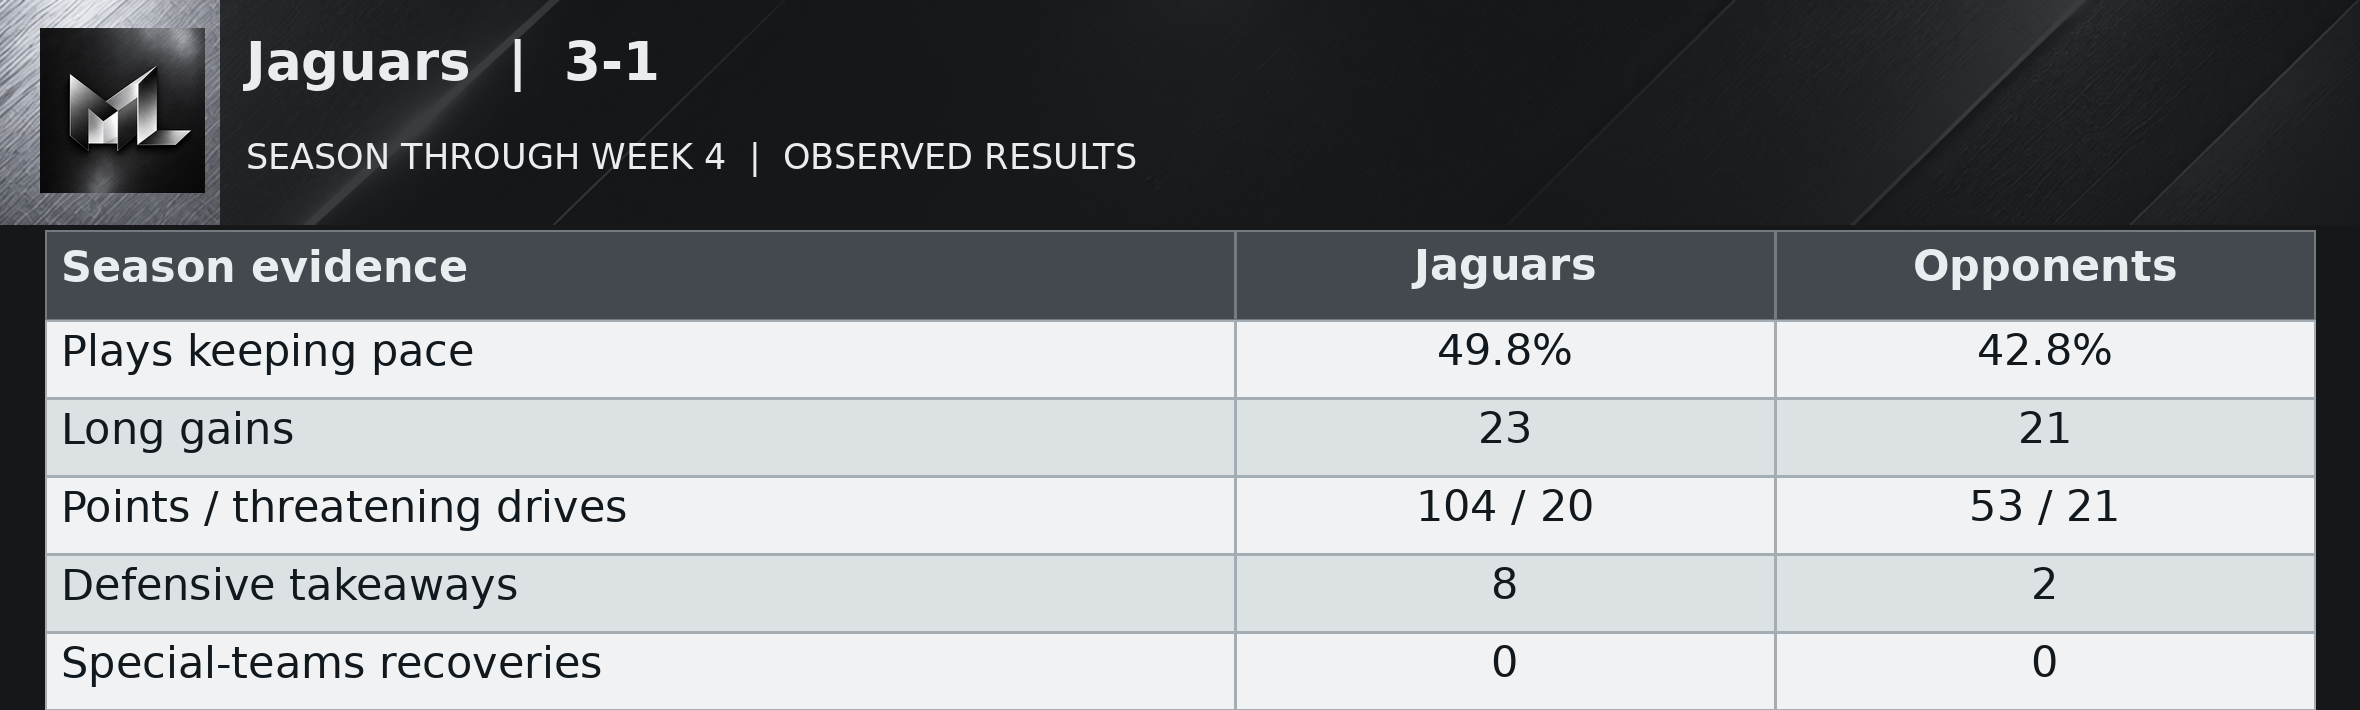
Jaguars | 3-1
Read the table as text
| Season evidence | Jaguars | Opponents |
|---|---|---|
| Plays keeping pace | 49.8% | 42.8% |
| Long gains | 23 | 21 |
| Points / threatening drives | 104 / 20 | 53 / 21 |
| Defensive takeaways | 8 | 2 |
| Special-teams recoveries | 0 | 0 |
Jacksonville has blended three dependable advantages: very few giveaways, repeated defensive takeaways and strong resistance when opponents threaten to score. Its opponents have collected only 53 offensive points from 21 threatening drives, while Jacksonville has returned 104 from 20. All eight takeaways were defensive plays, and the offense has given the ball away only twice. That combination explains a 3-1 start more convincingly than treating the latest 22-17 win as a stand-alone escape.
The offense still changes considerably from week to week. Its useful gains ranged from 43.6 to 60.4 percent of plays, and Sunday's 44.2 percent was closer to the lower end. Trevor Lawrence said “You’re going to have to win games like this”. True, but the defense cannot be the answer to every stalled possession. Jacksonville added six long gains Sunday after only three in the previous win. Its strongest season habit is protecting and recovering possession; maintaining ordinary progress would make the narrow finishes less necessary.
After opponent punts or failed fourth downs, Jaguars possessions have begun at their own 23.6, on average, across 12 competitive drives. The weekly average has varied widely, from their own 19.0 to their own 31.3. The latest game averaged their own 21.5. The resulting possession started at midfield or closer to the end zone in 0 of those 12 cases. These are actual starting spots, including punt returns, rather than a measure of the defense alone. The return unit has added 15 punt-return yards over the season. Starts following turnovers are counted separately: 8 competitive possessions at their own 45.9 on average.
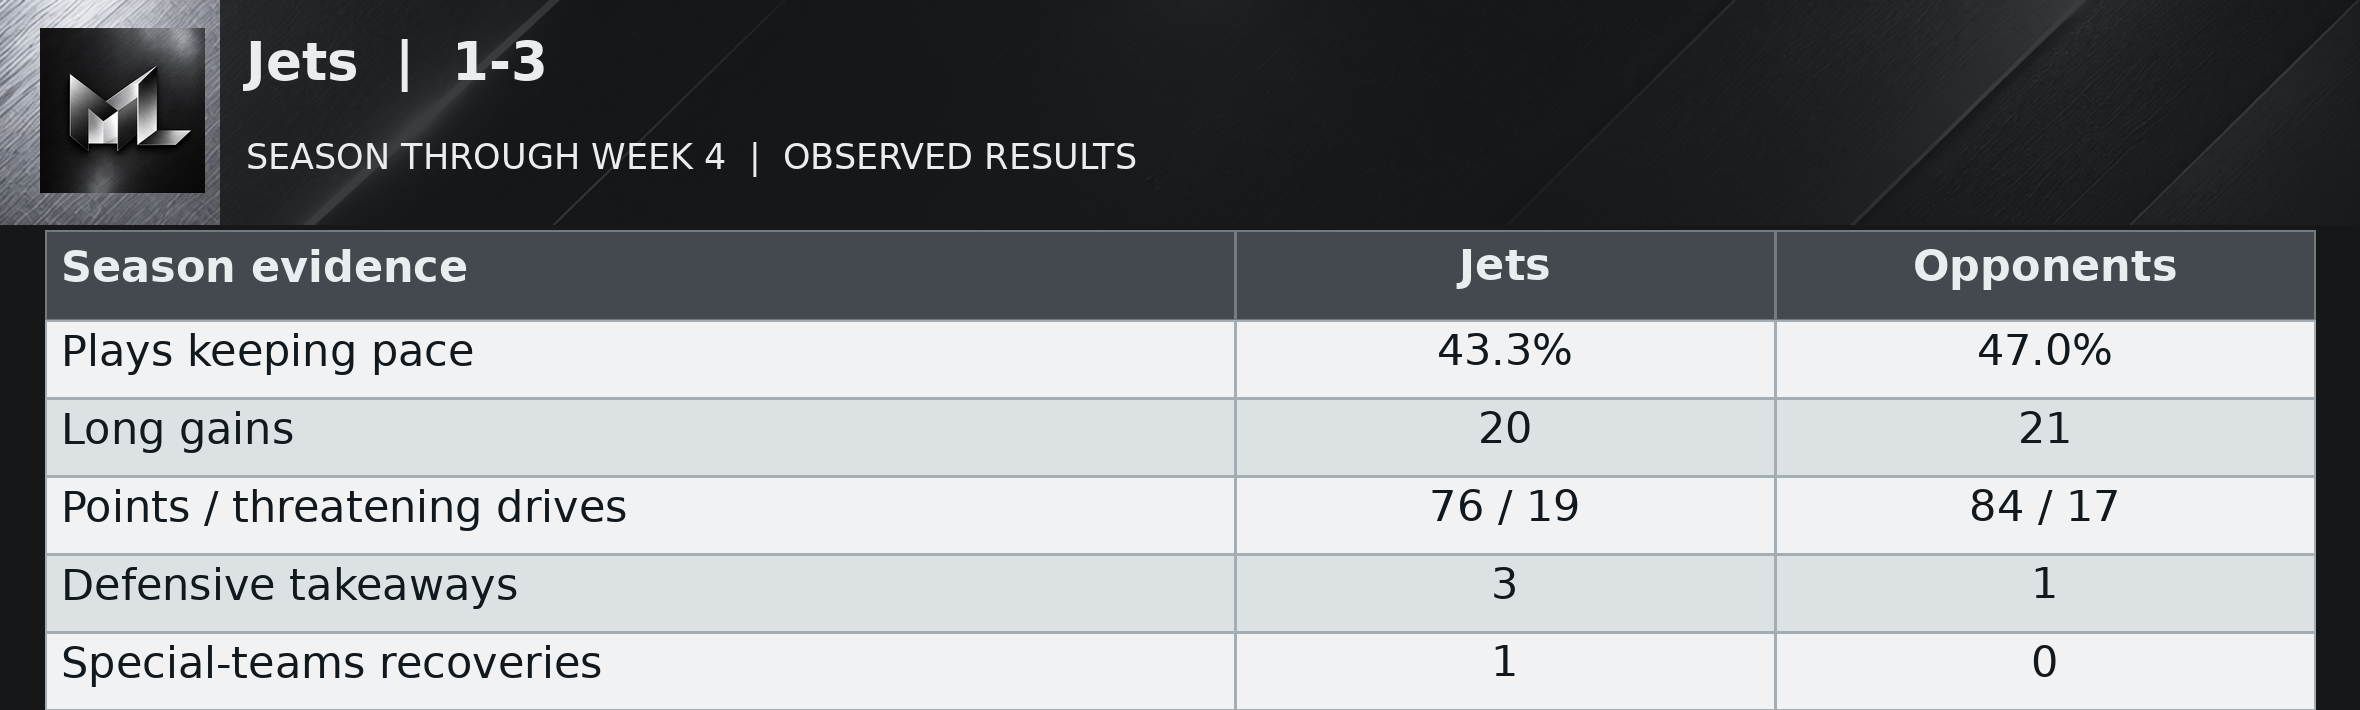
Jets | 1-3
Read the table as text
| Season evidence | Jets | Opponents |
|---|---|---|
| Plays keeping pace | 43.3% | 47.0% |
| Long gains | 20 | 21 |
| Points / threatening drives | 76 / 19 | 84 / 17 |
| Defensive takeaways | 3 | 1 |
| Special-teams recoveries | 1 | 0 |
The Jets have taken care of the ball, giving it away only once in four games, but clean possession has not become dependable possession. Their weekly useful-play shares have swung from 48.3 to 33.8 to 50.8 to 40.6 percent. The defense has allowed useful progress on 47.0 percent of plays and 84 offensive points from only 17 threatening drives. Three of the team's four takeaways were defensive, with the other coming on special teams. None of that adds up to enough stops and sustained answers.
Geno Smith said “keep our defense off the field”. Sunday's 0-for-7 third-down showing and the 89-to-32 play imbalance against Chicago make that less a slogan than an urgent instruction. The two takeaways did not rescue an offense that produced just two long gains. Chicago's waste near the goal line kept the 23-12 result within reach longer than the possession gap justified. New York's 1-3 season needs more than another clean giveaway column. It needs reasons to keep the next possession.
After opponent punts or failed fourth downs, Jets possessions have begun at their own 21.9, on average, across 17 competitive drives. The weekly average has varied widely, from their own 1.0 to their own 27.3. The latest game averaged their own 1.0. The resulting possession started at midfield or closer to the end zone in 1 of those 17 cases. These are actual starting spots, including punt returns, rather than a measure of the defense alone. The return unit has added 31 punt-return yards over the season. Starts following turnovers are counted separately: 4 competitive possessions at their opponent 29.5 on average.
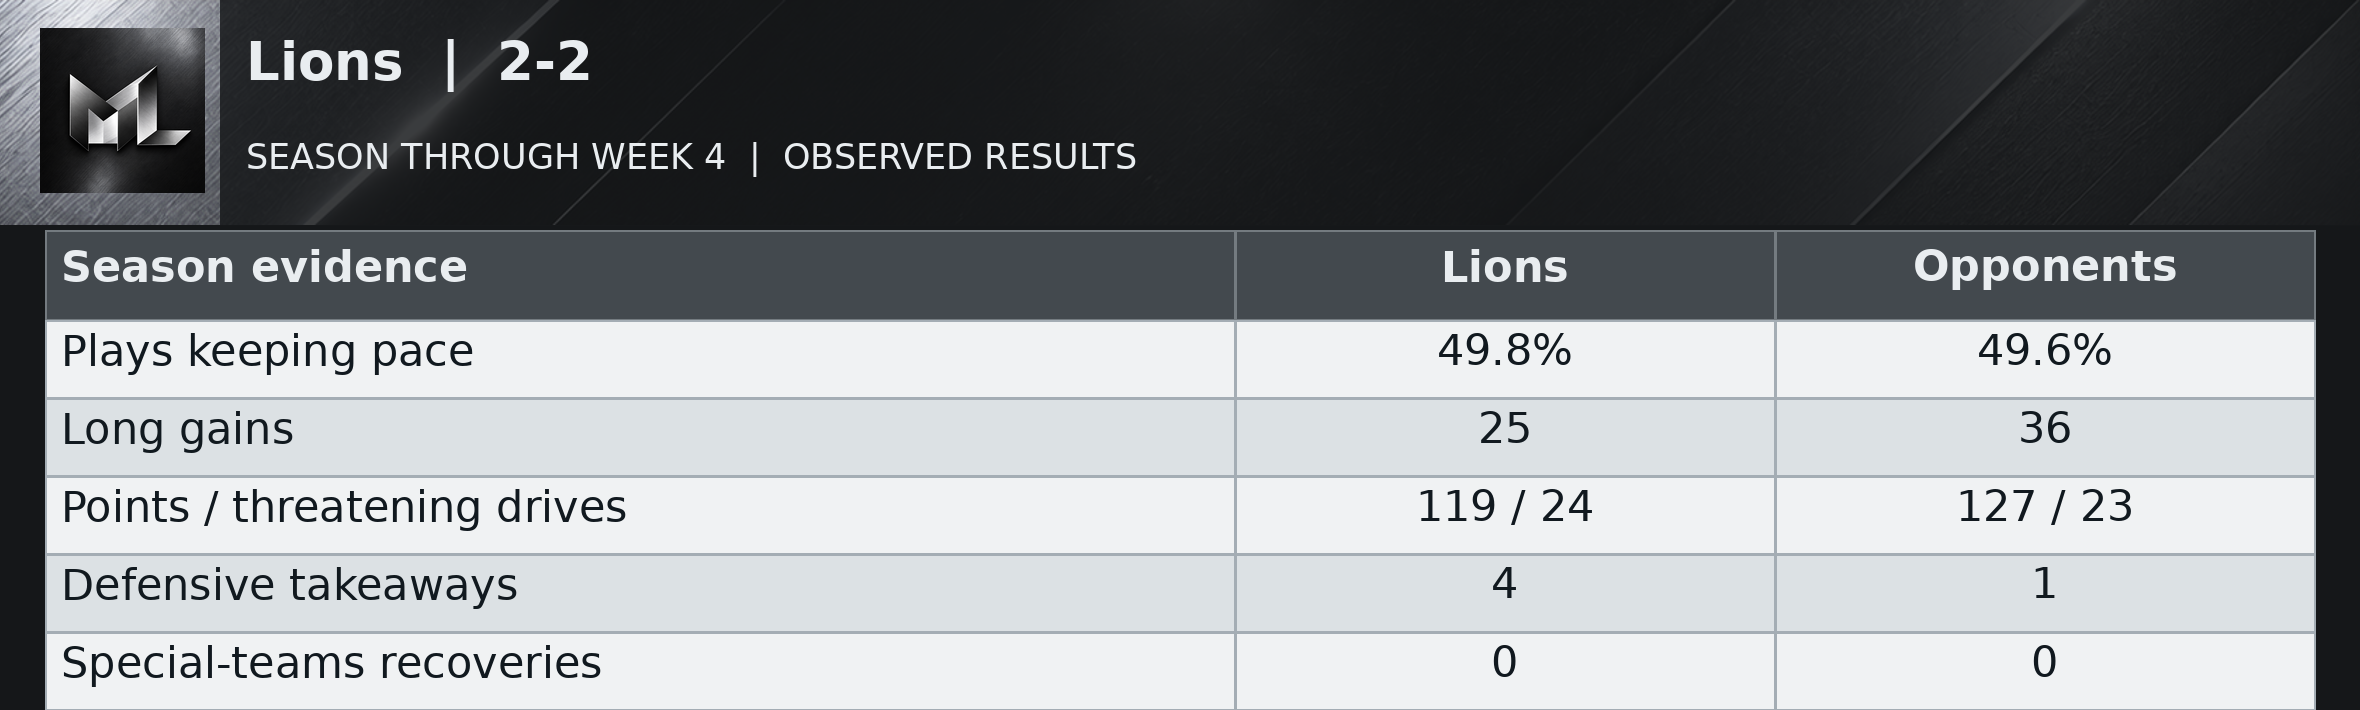
Lions | 2-2
Read the table as text
| Season evidence | Lions | Opponents |
|---|---|---|
| Plays keeping pace | 49.8% | 49.6% |
| Long gains | 25 | 36 |
| Points / threatening drives | 119 / 24 | 127 / 23 |
| Defensive takeaways | 4 | 1 |
| Special-teams recoveries | 0 | 0 |
Detroit has protected possession better than almost anyone, with one giveaway through four games. Its offense has also produced at least 26 points each week. The missing complement is preventing opponents from making the same progress. Detroit has allowed useful gains on 49.6 percent of plays and 36 long gains against 25 created. Opponents have taken 127 offensive points from 23 threatening drives, more than Detroit's 119 from 24. Clean offense cannot keep canceling the defense's invoice.
Dan Campbell said “we had our opportunities”. Sunday's 32-26 loss supplied eight threatening possessions for Detroit, yet those returned only 26 points, its weakest finishing game of the season. The offense's ordinary movement also fell from 64.5 percent of plays in Week 3 to 44.1 percent. Neither team gave the ball away, so there is no turnover explanation to shelter the defense from Carolina's sustained work. The Lions are 2-2 because their own strong possessions have too often required another strong possession immediately afterward.
After opponent punts or failed fourth downs, Lions possessions have begun at their own 22.5, on average, across 13 competitive drives. The weekly average has varied widely, from their own 16.0 to their own 27.0. The latest game averaged their own 19.0. The resulting possession started at midfield or closer to the end zone in 1 of those 13 cases. These are actual starting spots, including punt returns, rather than a measure of the defense alone. The return unit has added 46 punt-return yards over the season. Pre-snap changes before the first run or pass affected 2 of these drives; those changes are excluded from the listed starting spots. Starts following turnovers are counted separately: 3 competitive possessions at their opponent 43.3 on average.
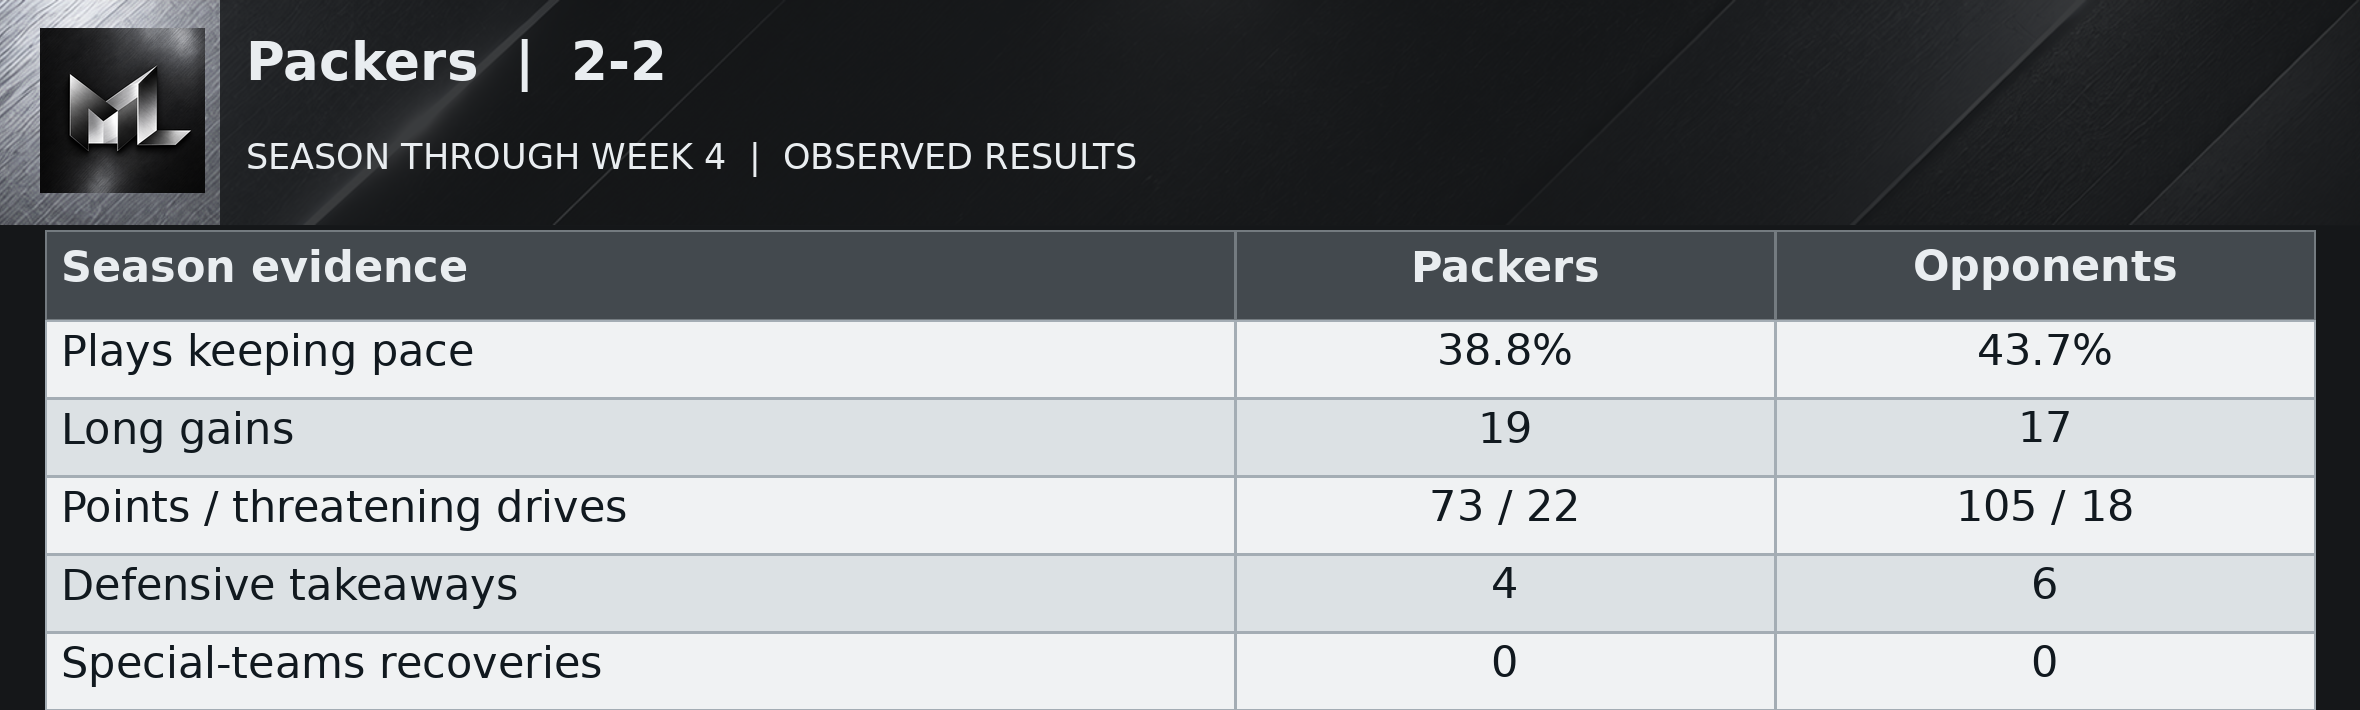
Packers | 2-2
Read the table as text
| Season evidence | Packers | Opponents |
|---|---|---|
| Plays keeping pace | 38.8% | 43.7% |
| Long gains | 19 | 17 |
| Points / threatening drives | 73 / 22 | 105 / 18 |
| Defensive takeaways | 4 | 6 |
| Special-teams recoveries | 0 | 0 |
Green Bay has been consistently modest at ordinary offensive progress and much less consistent at finishing. Its weekly useful-play share stayed between 34.0 and 42.3 percent, while its points from threatening drives ran 22 on eight, 20 on four, 14 on five and 17 on five. Opponents have earned 105 offensive points from only 18 threatening possessions against Green Bay's 73 from 22. The Packers have also given the ball away in every game, six times overall.
Matt LaFleur said “not to our standard”. Sunday's 17-14 win fits that assessment better than a celebration of being back to 2-2. The offense produced only three long gains and lost the ball twice after receiving much better ordinary starting positions than the previous week. The defense took the ball away twice and held Tampa Bay to two threatening drives. That was enough this time. Requiring the defense to keep the opponent below 17 is a demanding way to make a weekly offensive plan.
After opponent punts or failed fourth downs, Packers possessions have begun at their own 29.9, on average, across 18 competitive drives. The weekly average has varied widely, from their own 12.0 to their own 39.5. The latest game averaged their own 39.5. The resulting possession started at midfield or closer to the end zone in 4 of those 18 cases. These are actual starting spots, including punt returns, rather than a measure of the defense alone. The return unit has added 128 punt-return yards over the season. Pre-snap changes before the first run or pass affected 4 of these drives; those changes are excluded from the listed starting spots. Starts following turnovers are counted separately: 4 competitive possessions at their own 45.0 on average.
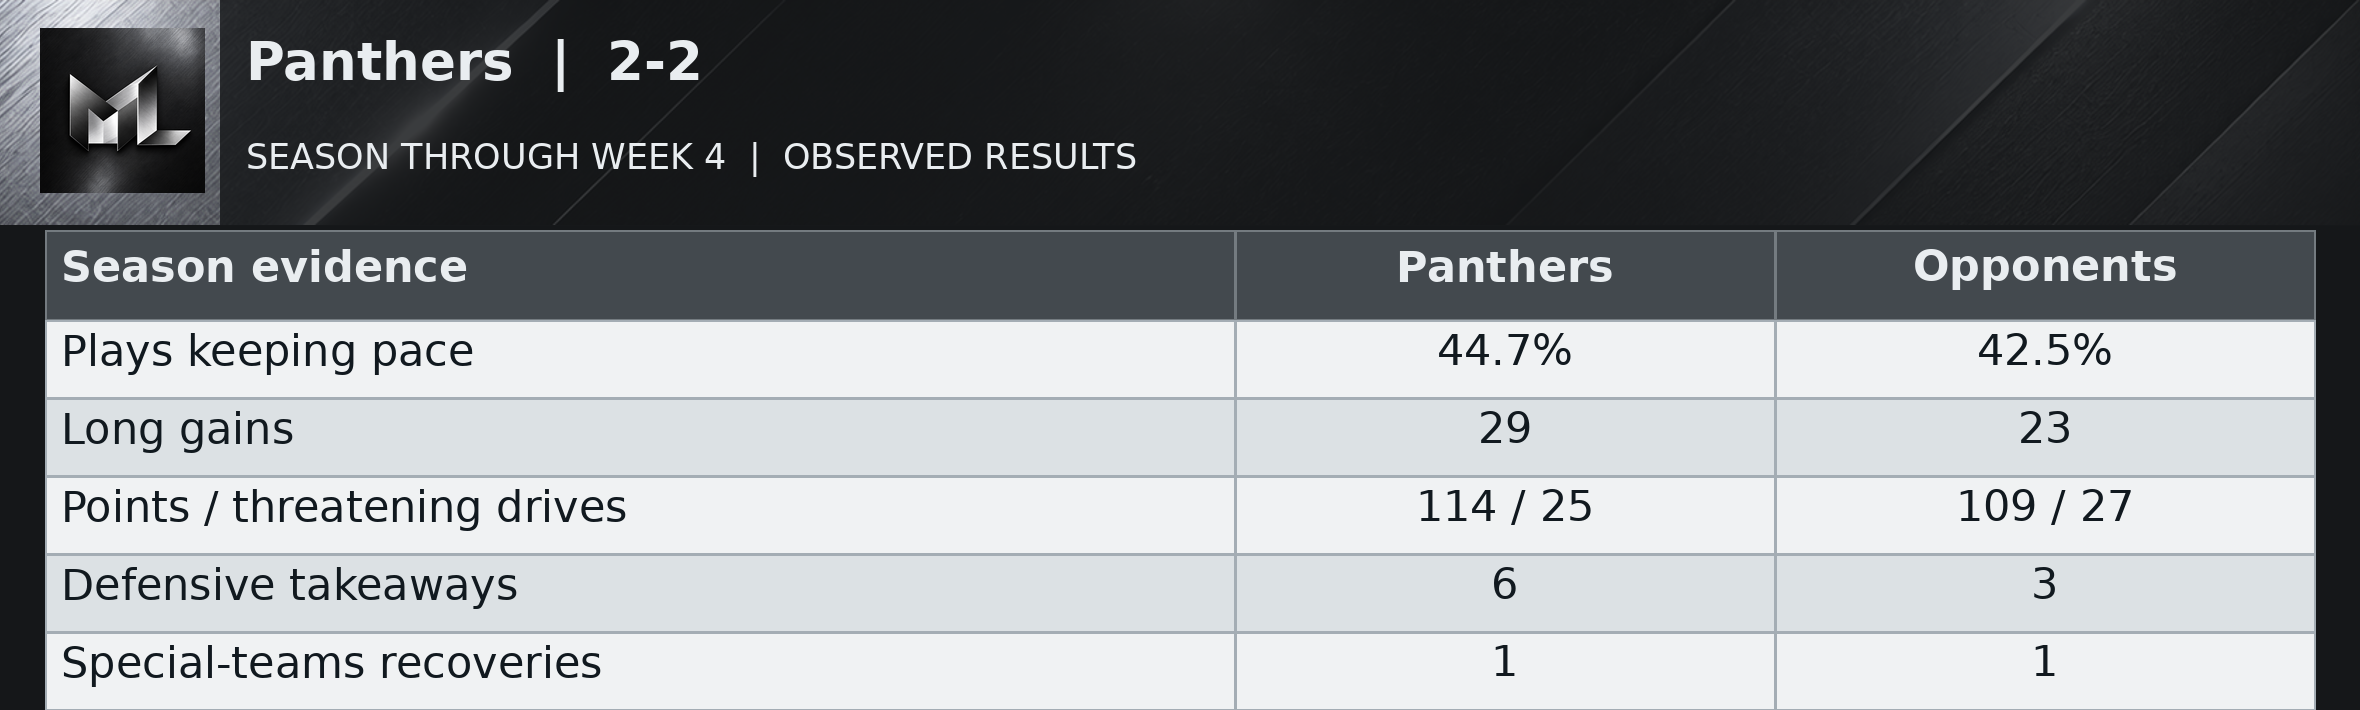
Panthers | 2-2
Read the table as text
| Season evidence | Panthers | Opponents |
|---|---|---|
| Plays keeping pace | 44.7% | 42.5% |
| Long gains | 29 | 23 |
| Points / threatening drives | 114 / 25 | 109 / 27 |
| Defensive takeaways | 6 | 3 |
| Special-teams recoveries | 1 | 1 |
Carolina has enough offensive variety to trouble opponents, but almost nothing about its season has been steady. The offense's useful gains ranged from 34.2 to 54.3 percent; the scores ran 37, 34, 18 and 32. It has produced 29 long gains while allowing 23, so it can create quick answers without reliably preventing them. Five of its seven takeaways came in the Atlanta game. One season takeaway came on special teams, and one giveaway did too. That landslide should not become the weekly expectation.
Tetairoa McMillan said “Everything just clicked tonight”. His 14 catches for 192 yards against Detroit explain the feeling, while the season explains the word tonight. Sunday's 32 points on six threatening drives came without a giveaway or a takeaway. That is stronger evidence of offense sustaining itself than the short fields in the Atlanta rout. The defense has nevertheless surrendered 109 offensive points from 27 threatening possessions. At 2-2, Carolina has shown a high ceiling and plenty of room beneath it.
After opponent punts or failed fourth downs, Panthers possessions have begun at their own 28.3, on average, across 15 competitive drives. The weekly average has varied widely, from their own 18.0 to their opponent 39.5. The latest game averaged their own 18.0. The resulting possession started at midfield or closer to the end zone in 2 of those 15 cases. These are actual starting spots, including punt returns, rather than a measure of the defense alone. The return unit has added 80 punt-return yards over the season. Starts following turnovers are counted separately: 5 competitive possessions at their opponent 36.6 on average.
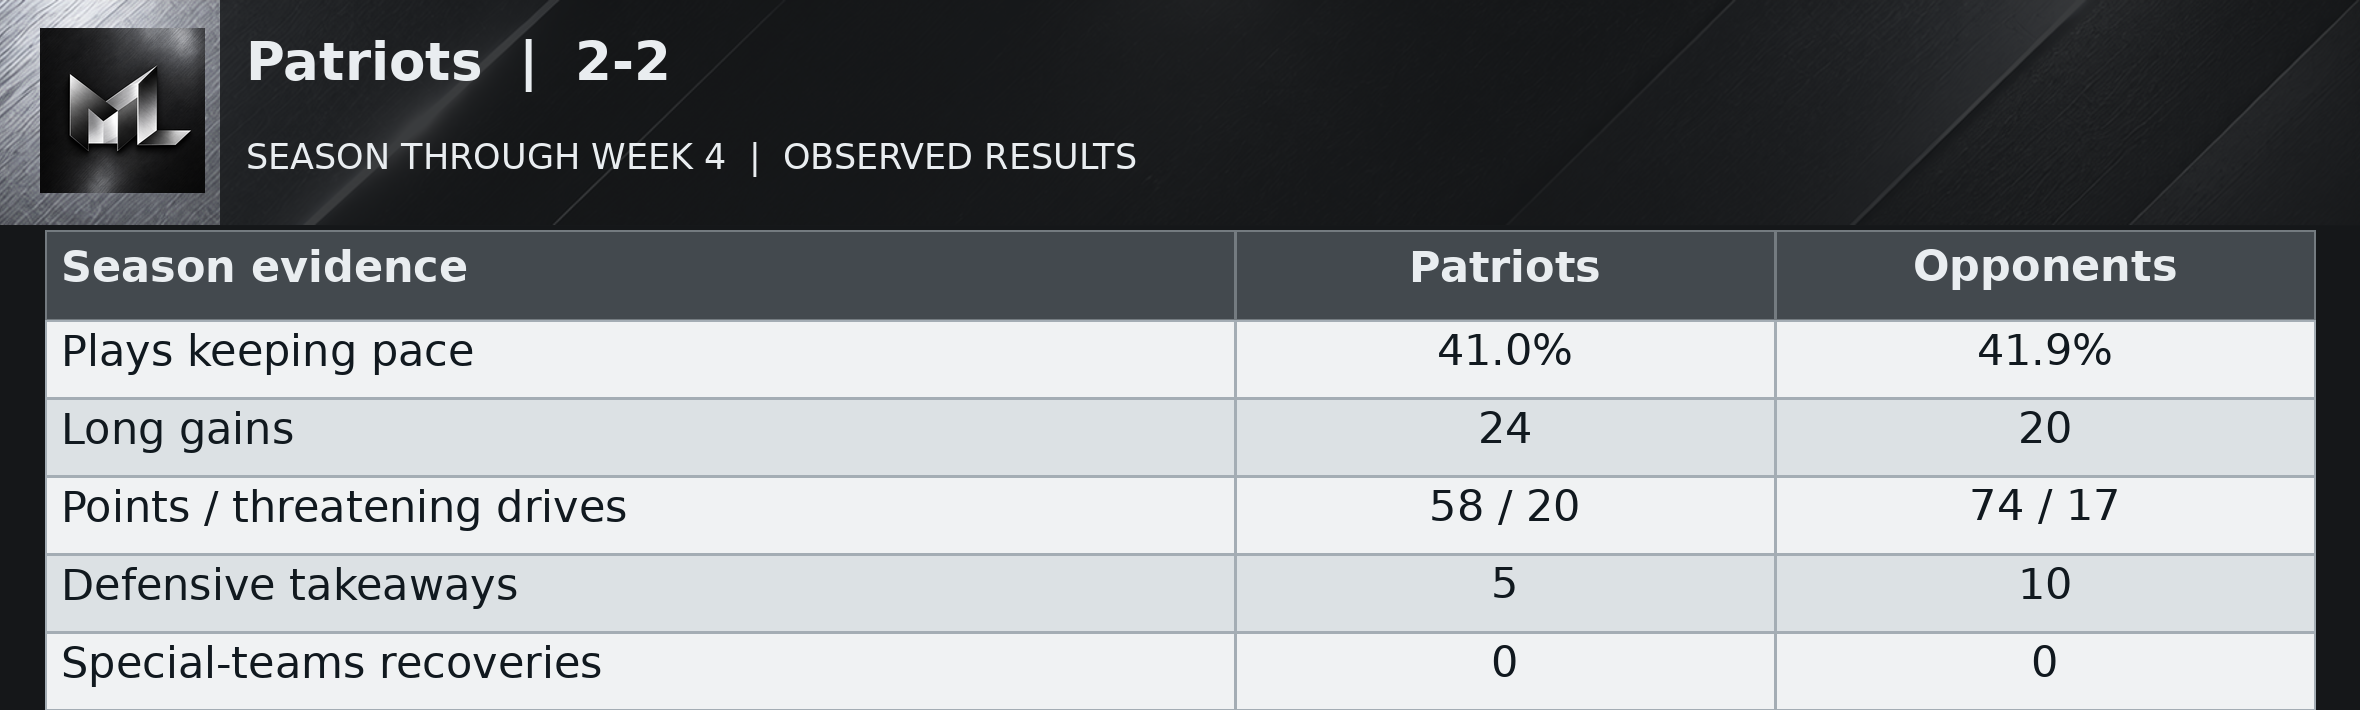
Patriots | 2-2
Read the table as text
| Season evidence | Patriots | Opponents |
|---|---|---|
| Plays keeping pace | 41.0% | 41.9% |
| Long gains | 24 | 20 |
| Points / threatening drives | 58 / 20 | 74 / 17 |
| Defensive takeaways | 5 | 10 |
| Special-teams recoveries | 0 | 0 |
New England's cleanest recurring description is repeated offensive waste followed by one much better performance. The offense produced 29 points from its first 15 threatening possessions across three games, then 29 from five Sunday. Its share of useful plays rose to 49.3 percent after staying between 35.0 and 41.2. That is a meaningful improvement, not four games of dependable scoring. The possession problem persisted: giveaways have run three, two, three and two, all outside special teams.
The 29-26 win at Buffalo showed the Patriots can sustain long drives rather than survive exclusively on takeaways. They gained 405 yards and 26 first downs while the defense added two interceptions or recoveries. Across the season, opponents have returned 74 offensive points from 17 threatening drives against New England's 58 from 20. The Patriots' 2-2 record now has a convincing offensive example behind it. Repeating that without giving the opponent two additional possessions would be an even more useful next step.
After opponent punts or failed fourth downs, Patriots possessions have begun at their own 22.4, on average, across 20 competitive drives. The weekly average has varied widely, from their own 13.0 to their own 32.3. The latest game averaged their own 25.8. The resulting possession started at midfield or closer to the end zone in 1 of those 20 cases. These are actual starting spots, including punt returns, rather than a measure of the defense alone. The return unit has added 77 punt-return yards over the season. Pre-snap changes before the first run or pass affected 1 of these drives; those changes are excluded from the listed starting spots. Starts following turnovers are counted separately: 4 competitive possessions at their own 41.5 on average.
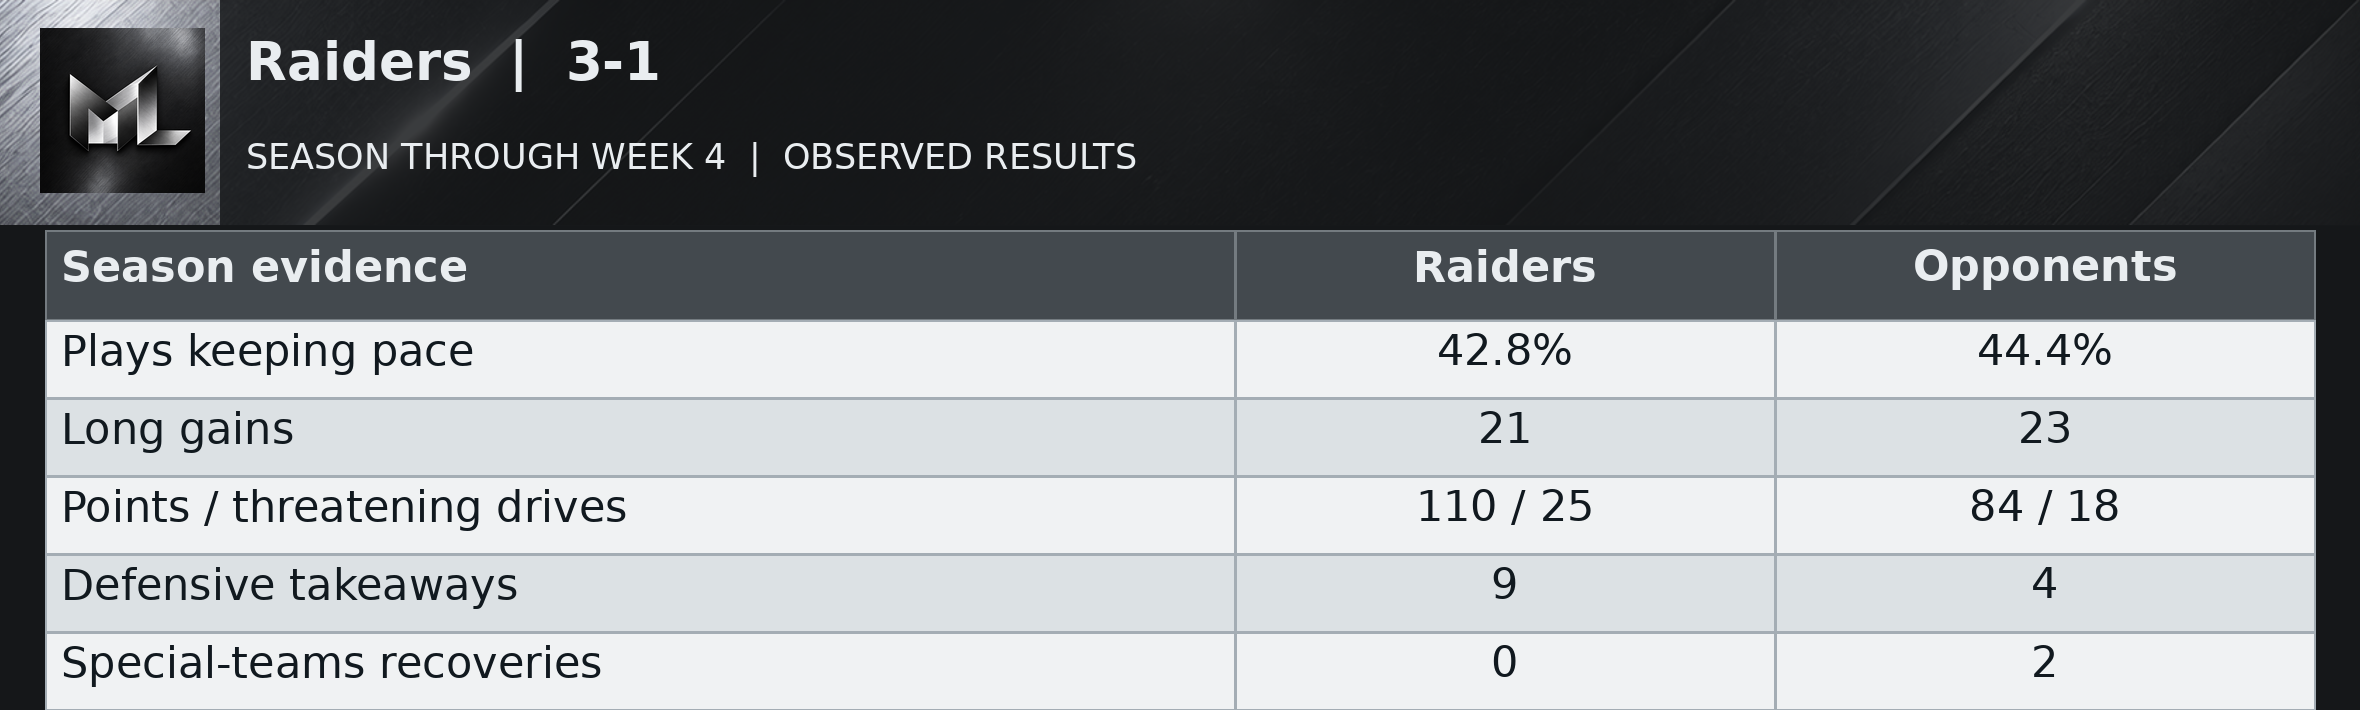
Raiders | 3-1
Read the table as text
| Season evidence | Raiders | Opponents |
|---|---|---|
| Plays keeping pace | 42.8% | 44.4% |
| Long gains | 21 | 23 |
| Points / threatening drives | 110 / 25 | 84 / 18 |
| Defensive takeaways | 9 | 4 |
| Special-teams recoveries | 0 | 2 |
Las Vegas's early success leaned heavily on extra possessions. It took the ball away two, three and four times in its first three games, then not at all in the 30-27 loss to Kansas City. All nine season takeaways were defensive. The offense has given it away six times, including two special-teams mistakes, so even the favorable overall exchange contains avoidable waste. Its regular offensive movement improved Sunday, but season opponents have still stayed on schedule more often than the Raiders.
Klint Kubiak said “We've got to find that answer”. The latest 72 rushing yards at 2.8 per carry show why he was discussing the run game. Eight long gains helped Las Vegas remain competitive, yet seven threatening possessions produced only 27 points. A kickoff fumble after Kansas City went ahead made the next task much harder. That was not the Chiefs' defense stripping the Raiders' offense. The 3-1 start is real; Sunday showed how the team looks when the takeaways stop arriving and the kicking unit adds a problem.
After opponent punts or failed fourth downs, Raiders possessions have begun at their own 24.2, on average, across 19 competitive drives. The weekly average has varied widely, from their own 16.7 to their own 28.8. The latest game averaged their own 16.7. The resulting possession started at midfield or closer to the end zone in 1 of those 19 cases. These are actual starting spots, including punt returns, rather than a measure of the defense alone. The return unit has added 68 punt-return yards over the season. Starts following turnovers are counted separately: 7 competitive possessions at their opponent 40.0 on average.
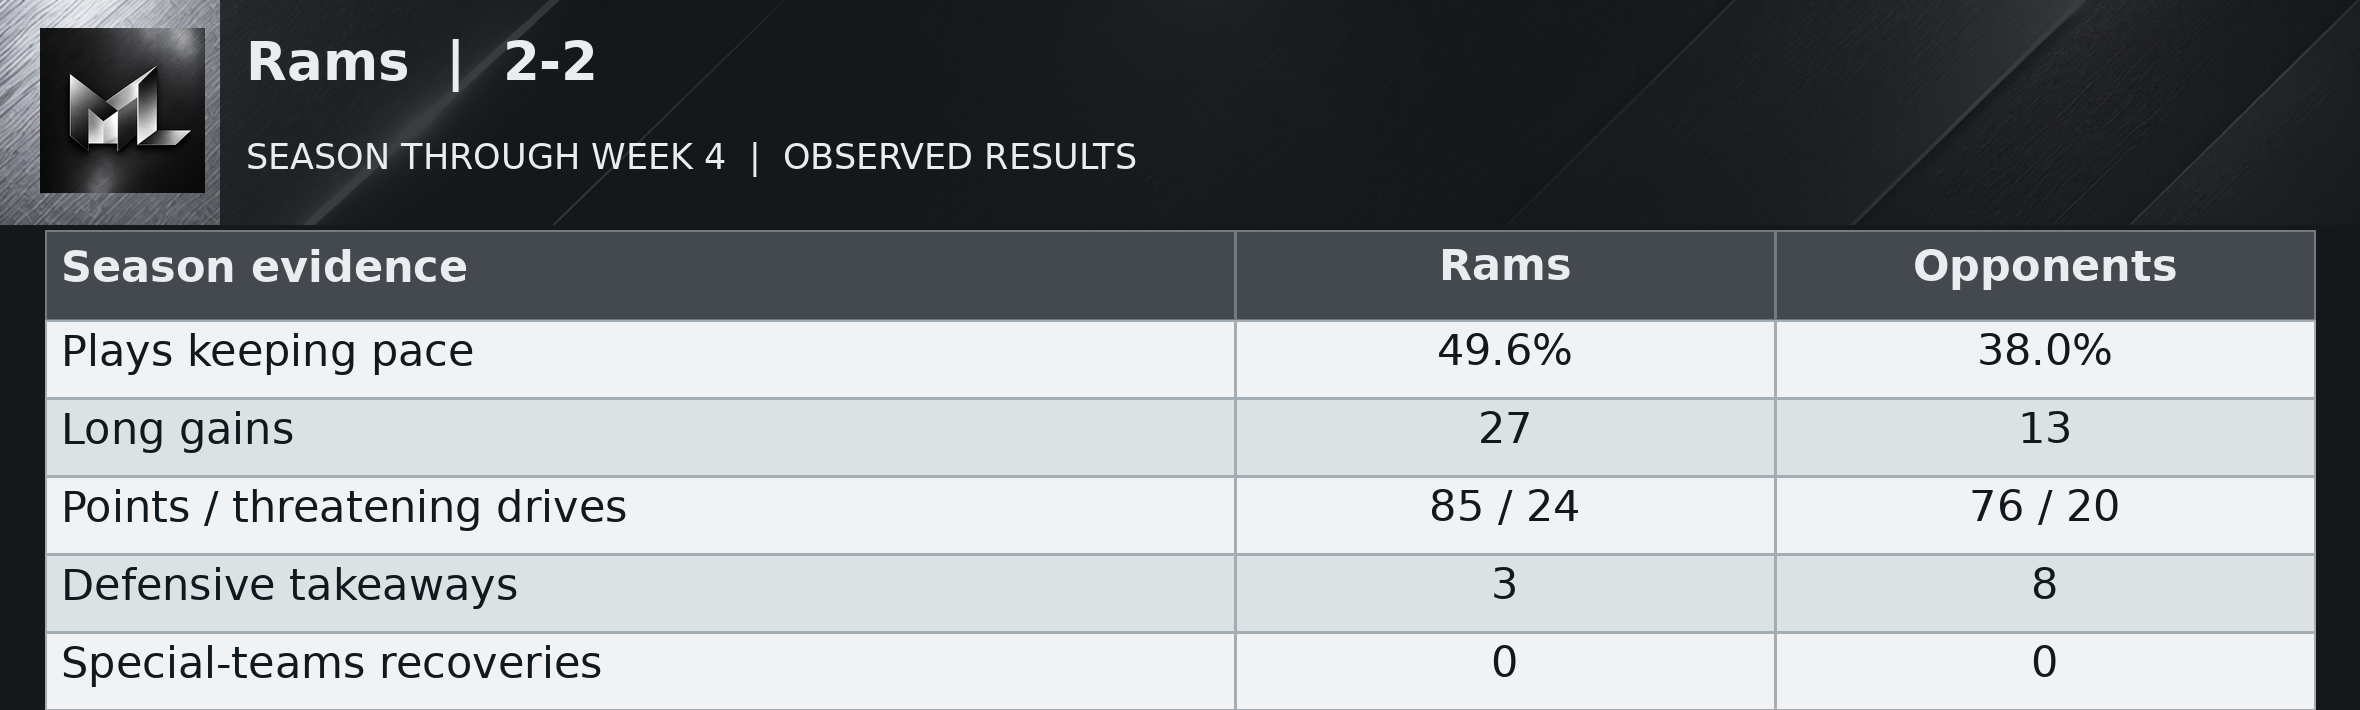
Rams | 2-2
Read the table as text
| Season evidence | Rams | Opponents |
|---|---|---|
| Plays keeping pace | 49.6% | 38.0% |
| Long gains | 27 | 13 |
| Points / threatening drives | 85 / 24 | 76 / 20 |
| Defensive takeaways | 3 | 8 |
| Special-teams recoveries | 0 | 0 |
The Rams have two competing season habits. They repeatedly make opponents struggle to maintain progress, allowing useful gains on only 38.0 percent of plays and just 13 long gains. They also give the ball away twice every week. Eight giveaways against three defensive takeaways have made their own strong stretches harder to trust. Their offense has moved well over the whole season, but 85 points from 24 threatening drives shows how often promising territory has produced too little.
Sean McVay said “our defense kept giving us a reason to believe”. Holding Philadelphia without a third-down conversion in 12 attempts backs that up. So does an offense completing late touchdown drives of 98 and 79 yards rather than waiting for a takeaway. Sunday's 24-20 comeback was also aided by Philadelphia's failed fourth down and a penalty on the long march. The win demonstrates that Los Angeles can finish. The identical weekly giveaway count demonstrates that it keeps volunteering to make finishing harder.
After opponent punts or failed fourth downs, Rams possessions have begun at their own 22.4, on average, across 21 competitive drives. The weekly average has varied widely, from their own 20.2 to their own 43.0. The latest game averaged their own 22.9. The resulting possession started at midfield or closer to the end zone in 1 of those 21 cases. These are actual starting spots, including punt returns, rather than a measure of the defense alone. The return unit has added 101 punt-return yards over the season. Pre-snap changes before the first run or pass affected 2 of these drives; those changes are excluded from the listed starting spots. Starts following turnovers are counted separately: 3 competitive possessions at their own 38.3 on average.
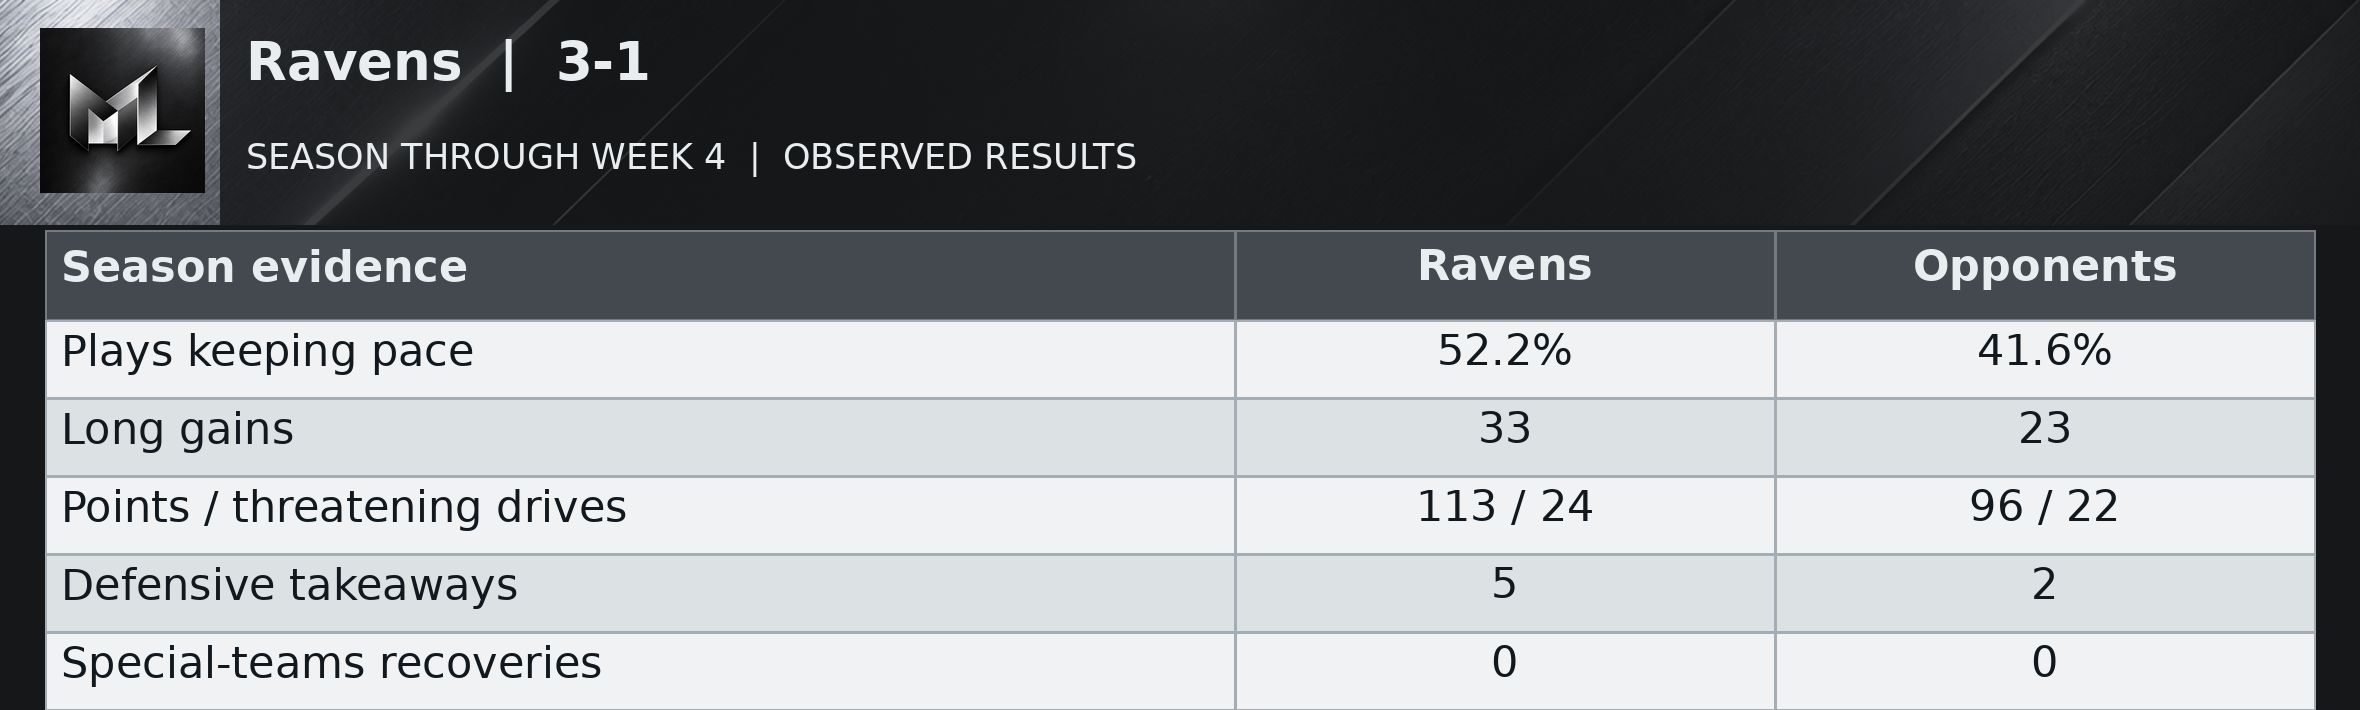
Ravens | 3-1
Read the table as text
| Season evidence | Ravens | Opponents |
|---|---|---|
| Plays keeping pace | 52.2% | 41.6% |
| Long gains | 33 | 23 |
| Points / threatening drives | 113 / 24 | 96 / 22 |
| Defensive takeaways | 5 | 2 |
| Special-teams recoveries | 0 | 0 |
Baltimore has consistently moved the ball better than its opponents, with useful gains on 52.2 percent of its plays against 41.6 percent allowed. Its 33 long gains are a real offensive weapon, but 23 allowed mean the defense has not removed the same escape route for opponents. The finishing has varied sharply, from 17 points on five threatening possessions in Week 2 to 21 on four Sunday. A separate long field goal supplied the other three points against Tennessee.
Jesse Minter said Baltimore played “more conservative in the second half”. With Lamar Jackson leaving injured and a 24-7 lead becoming a 24-18 finish, the explanation fits the circumstances; it does not turn a scoreless second half into a repeatable plan. Five defensive takeaways against two giveaways have helped, and neither total includes a return mistake. The goal-line stop was valuable, but the following touchdown required a 99-yard drive. Stopping someone and giving the offense a short field are different achievements.
After opponent punts or failed fourth downs, Ravens possessions have begun at their own 27.9, on average, across 18 competitive drives. The weekly average has varied widely, from their own 21.3 to their own 34.7. The latest game averaged their own 21.3. The resulting possession started at midfield or closer to the end zone in 2 of those 18 cases. These are actual starting spots, including punt returns, rather than a measure of the defense alone. The return unit has added 65 punt-return yards over the season. Pre-snap changes before the first run or pass affected 2 of these drives; those changes are excluded from the listed starting spots. Starts following turnovers are counted separately: 5 competitive possessions at their own 49.0 on average.
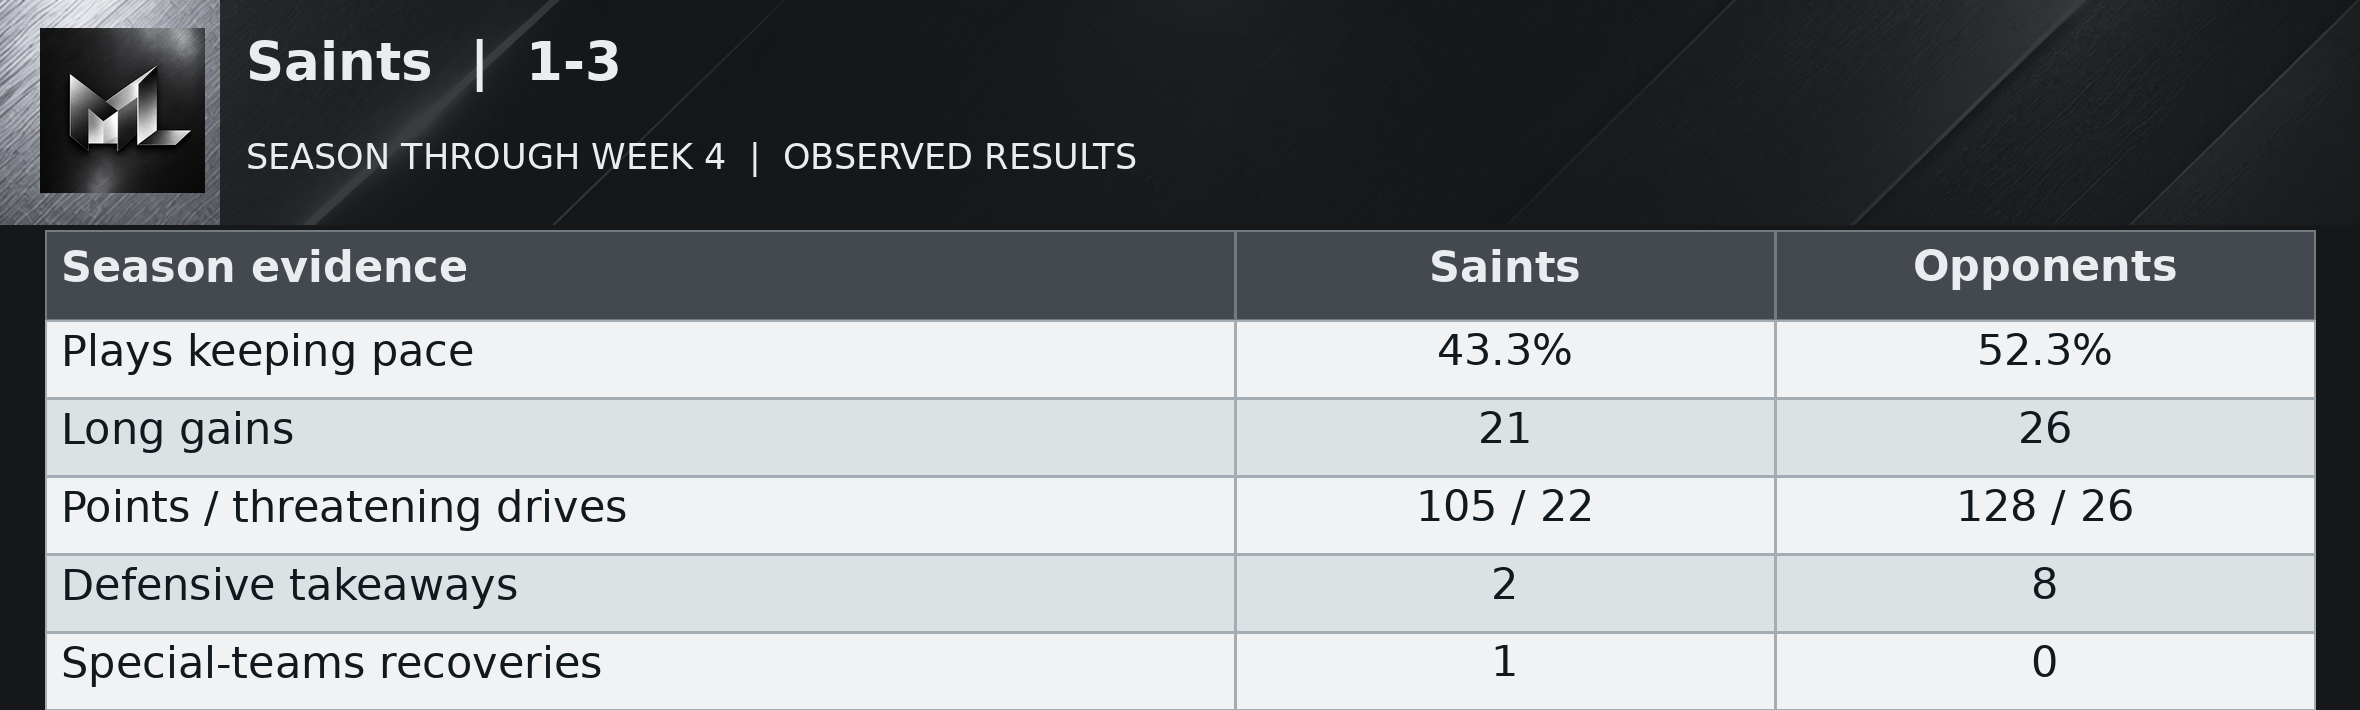
Saints | 1-3
Read the table as text
| Season evidence | Saints | Opponents |
|---|---|---|
| Plays keeping pace | 43.3% | 52.3% |
| Long gains | 21 | 26 |
| Points / threatening drives | 105 / 22 | 128 / 26 |
| Defensive takeaways | 2 | 8 |
| Special-teams recoveries | 1 | 0 |
New Orleans has repeatedly allowed opponents to move and finish with less resistance than its own offense receives. Opponents have made useful gains on 52.3 percent of plays, against the Saints' 43.3, and taken 128 offensive points from 26 threatening drives. The Saints have returned 105 from 22. Their offensive movement peaked in Week 3 but came with four giveaways. Monday brought fewer mistakes and still a 45-24 defeat, so possession alone does not explain the season's defensive problem.
Tyler Shough called the performance “embarrassing”. Allowing 205 rushing yards while producing 50, then watching Atlanta score on eight threatening possessions, gives the word numerical support. Kendre Miller's fumble created an early short field, and defensive holding extended the resulting touchdown drive. Those were two distinct forms of assistance. Only two of New Orleans's three team takeaways came from the defense; the other was on special teams. Eight giveaways, all outside special teams, have repeatedly added pressure to a defense already struggling without that help.
After opponent punts or failed fourth downs, Saints possessions have begun at their own 23.1, on average, across 15 competitive drives. The weekly average has varied widely, from their own 16.5 to their own 29.3. The latest game averaged their own 16.5. The resulting possession started at midfield or closer to the end zone in 0 of those 15 cases. These are actual starting spots, including punt returns, rather than a measure of the defense alone. The return unit has added 47 punt-return yards over the season. Pre-snap changes before the first run or pass affected 2 of these drives; those changes are excluded from the listed starting spots. Starts following turnovers are counted separately: 2 competitive possessions at their opponent 46.0 on average.
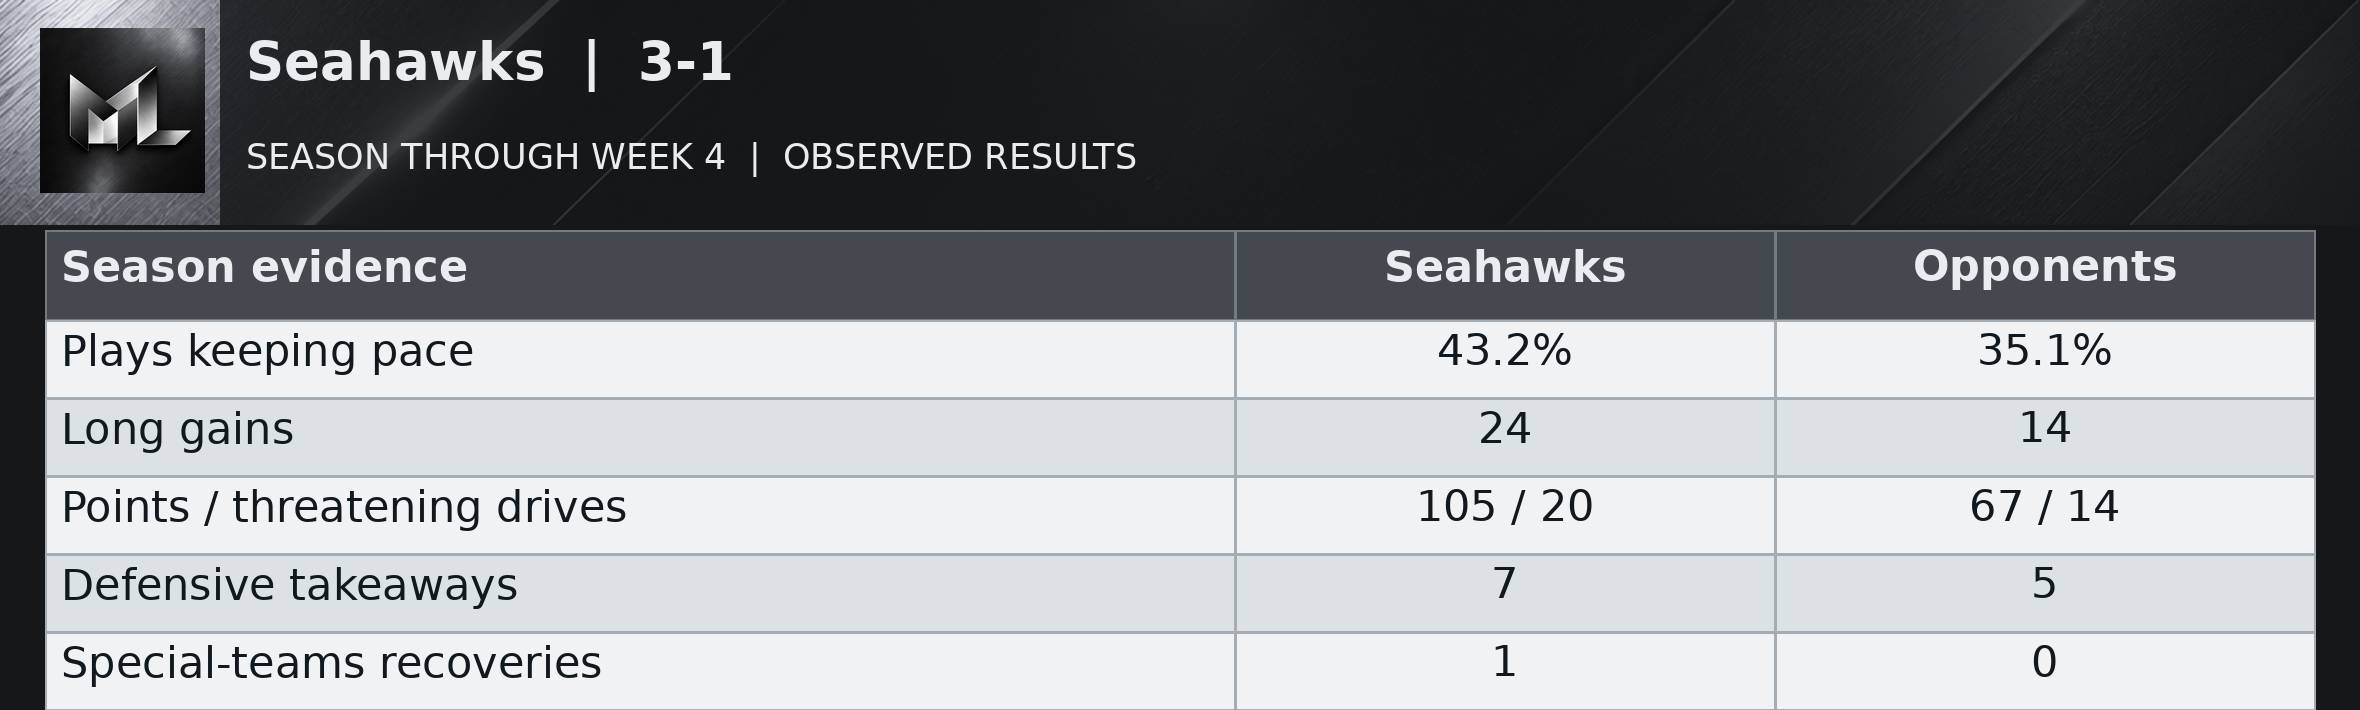
Seahawks | 3-1
Read the table as text
| Season evidence | Seahawks | Opponents |
|---|---|---|
| Plays keeping pace | 43.2% | 35.1% |
| Long gains | 24 | 14 |
| Points / threatening drives | 105 / 20 | 67 / 14 |
| Defensive takeaways | 7 | 5 |
| Special-teams recoveries | 1 | 0 |
Seattle's most convincing recurring strength is making opposing offenses work for ordinary gains. Opponents have kept pace with the down on only 35.1 percent of their plays, and Seattle has allowed 14 long gains against 24 of its own. The offense has scored at least 30 in three straight games, but those totals disguise changes in how the points arrived. Sunday brought its lowest share of useful plays, 35.7 percent, along with seven long gains and four extra possessions from mistakes.
Mike Macdonald acknowledged “a lot of room for improvement”. Fourteen penalties for 150 yards and a 27-6 lead that became a 30-23 win support him. Three of Sunday's recoveries or interceptions were defensive plays; the fourth was a muffed punt. Seven of eight season takeaways belong to the defense. The finishing has repeatedly been productive, but Seattle should not expect either opponent mistakes or long gains to make careless operation harmless. The rebound was useful. The bill for the penalties was still enormous.
After opponent punts or failed fourth downs, Seahawks possessions have begun at their own 25.1, on average, across 23 competitive drives. The weekly average has stayed in a fairly narrow band, from their own 22.0 to their own 28.0. The latest game averaged their own 28.0. The resulting possession started at midfield or closer to the end zone in 3 of those 23 cases. These are actual starting spots, including punt returns, rather than a measure of the defense alone. The return unit has added 79 punt-return yards over the season. Pre-snap changes before the first run or pass affected 2 of these drives; those changes are excluded from the listed starting spots. Starts following turnovers are counted separately: 6 competitive possessions at their opponent 41.0 on average.
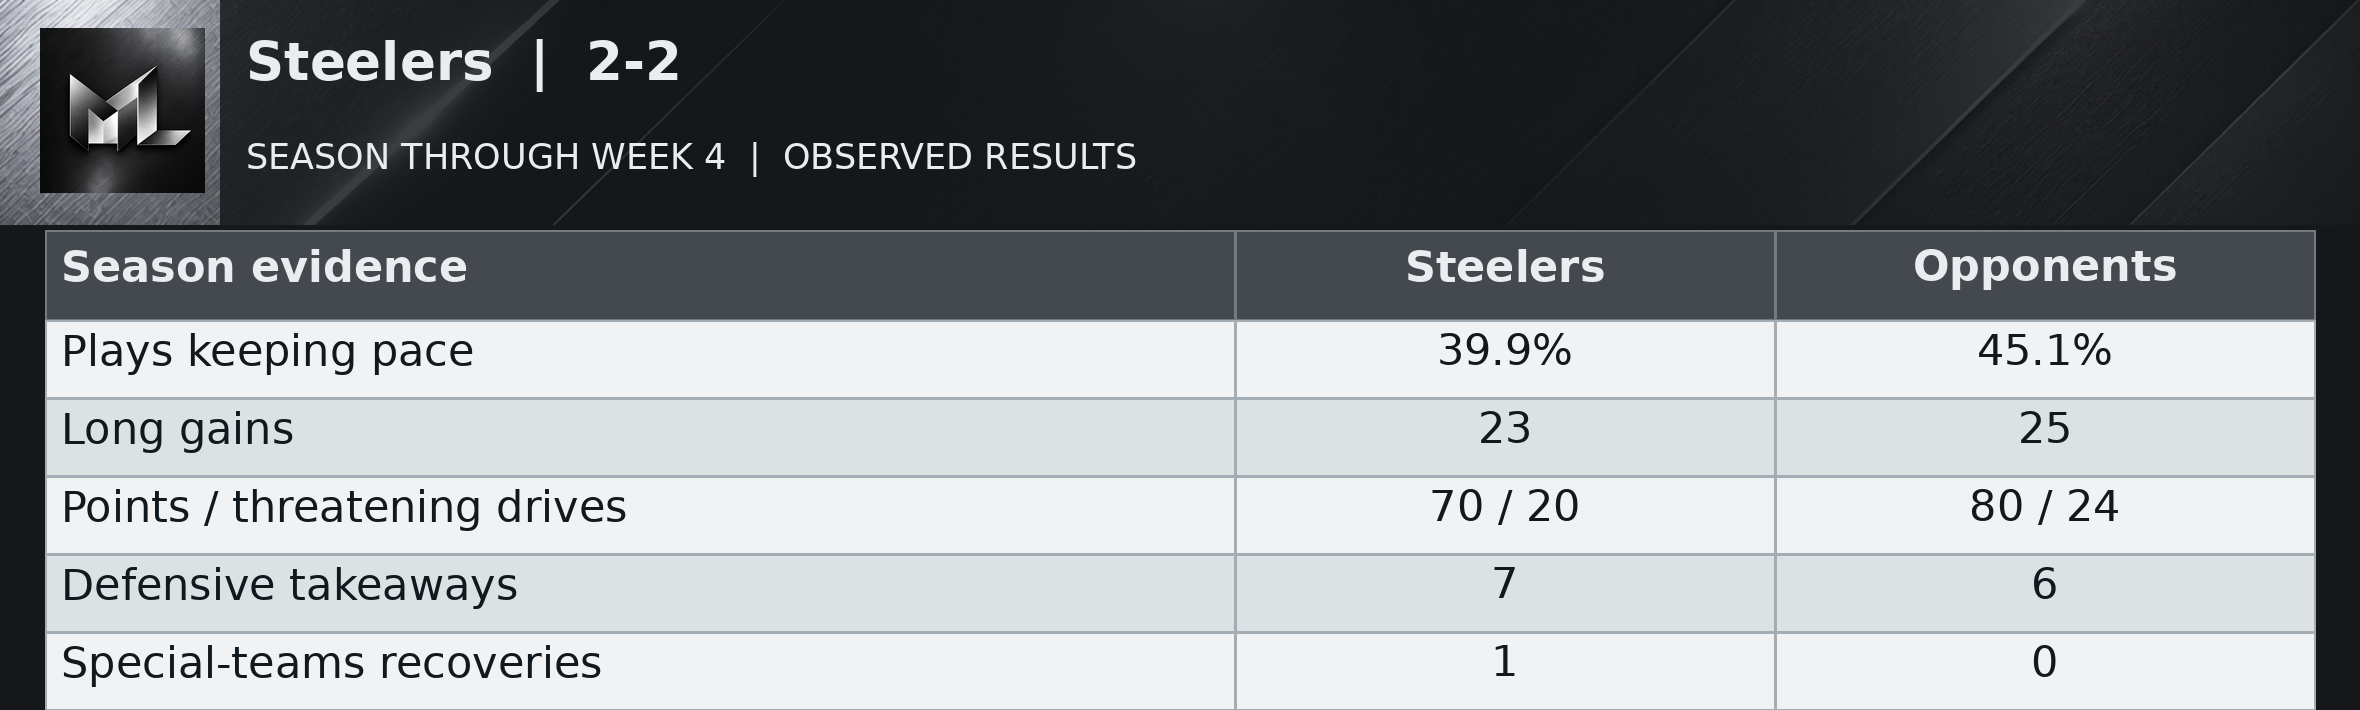
Steelers | 2-2
Read the table as text
| Season evidence | Steelers | Opponents |
|---|---|---|
| Plays keeping pace | 39.9% | 45.1% |
| Long gains | 23 | 25 |
| Points / threatening drives | 70 / 20 | 80 / 24 |
| Defensive takeaways | 7 | 6 |
| Special-teams recoveries | 1 | 0 |
Pittsburgh's offense has improved from its opening two games, but the improvement remains uneven. Its share of useful plays rose from 32.8 and 35.8 percent to 48.2 and 43.8. The long gains also increased from four and three to nine and seven. The defense has helped by allowing only 80 offensive points on 24 threatening possessions, but opponents have still made ordinary progress more frequently than Pittsburgh. Seven of eight takeaways were defensive, with one special-teams recovery.
Aaron Rodgers said, “I missed some throws I usually hit”. Two interceptions and five sacks in the 27-24 loss support the assessment, though his final interception came on a desperation throw and should not be treated as the same decision as an earlier live possession. The offense has given the ball away in every game, six times overall. Rallying from 21-7 behind demonstrated a capacity to recover. Allowing Cleveland the final scoring drive demonstrated that recovering late is not the same as controlling the game.
After opponent punts or failed fourth downs, Steelers possessions have begun at their own 19.2, on average, across 16 competitive drives. The weekly average has varied widely, from their own 11.5 to their own 23.0. The latest game averaged their own 21.5. The resulting possession started at midfield or closer to the end zone in 0 of those 16 cases. These are actual starting spots, including punt returns, rather than a measure of the defense alone. The return unit has added 69 punt-return yards over the season. Pre-snap changes before the first run or pass affected 1 of these drives; those changes are excluded from the listed starting spots. Starts following turnovers are counted separately: 6 competitive possessions at their own 42.8 on average.
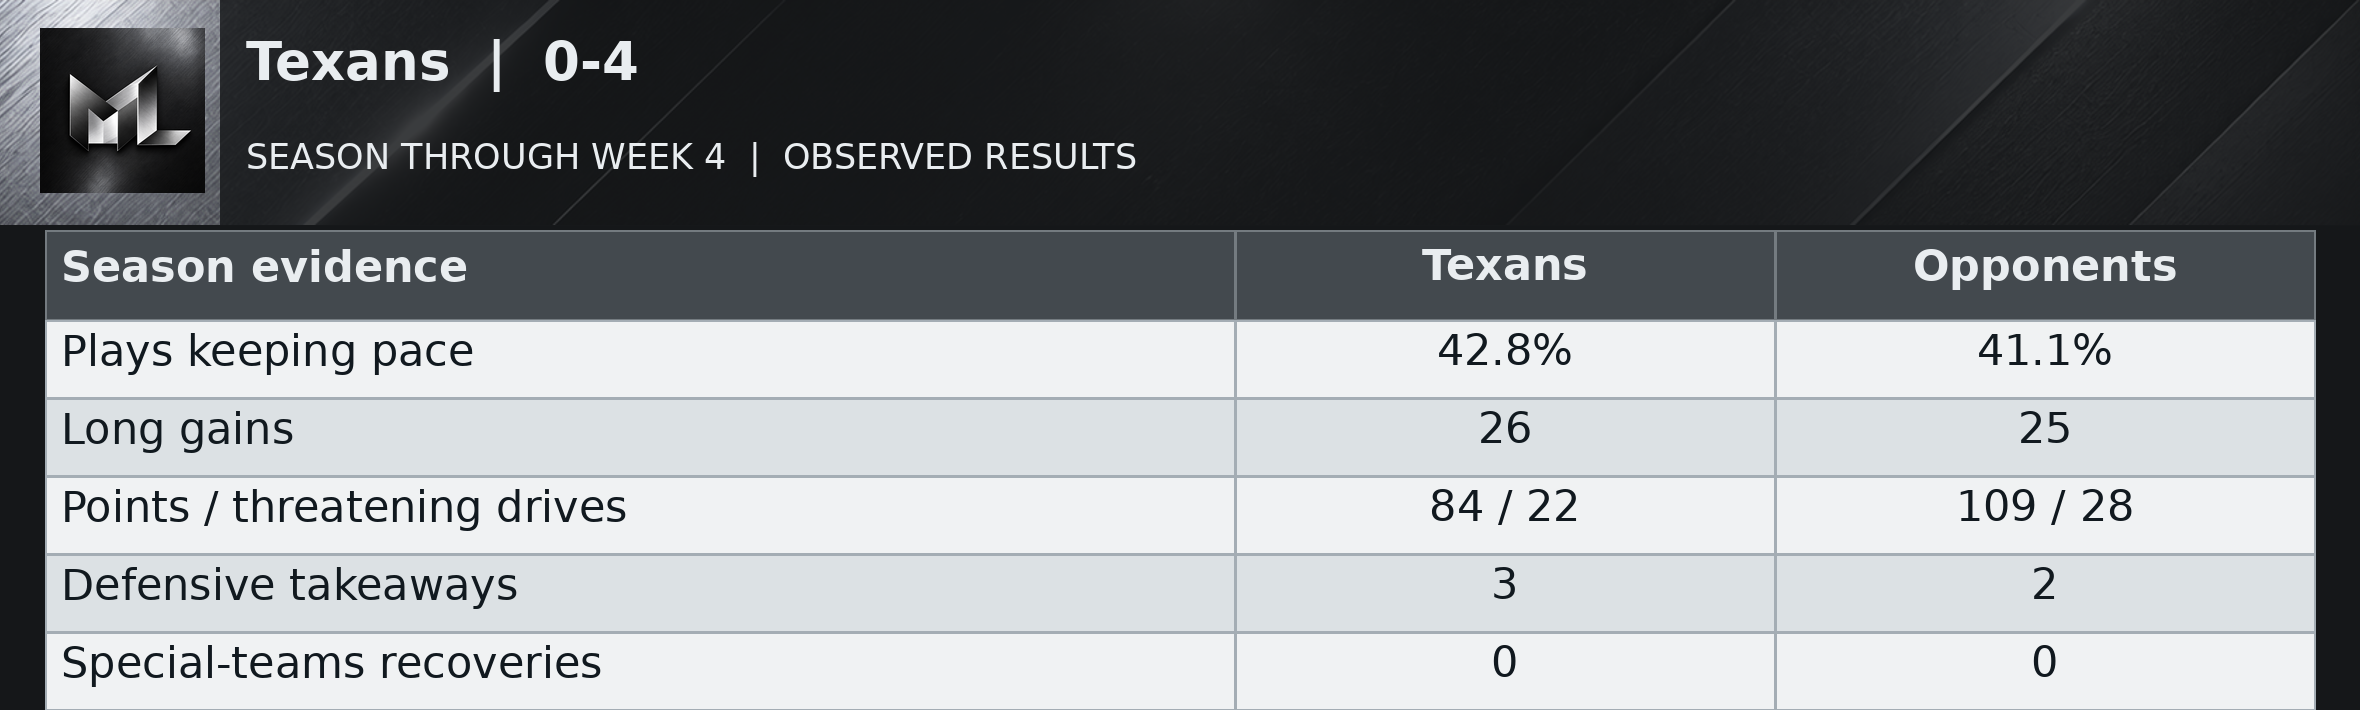
Texans | 0-4
Read the table as text
| Season evidence | Texans | Opponents |
|---|---|---|
| Plays keeping pace | 42.8% | 41.1% |
| Long gains | 26 | 25 |
| Points / threatening drives | 84 / 22 | 109 / 28 |
| Defensive takeaways | 3 | 2 |
| Special-teams recoveries | 0 | 0 |
Houston's 0-4 record is worse than its balance of ordinary offensive and defensive play, but the recurring failures are clear. The offense's useful gains have varied from 36.8 to 50.0 percent, and the Week 2 attack produced only six points from six threatening possessions. The defense has allowed opponents to create 28 threatening drives, more than Houston's 22. The Texans have lost close games without a repeated stream of giveaways: only two all season, both in the opener.
DeMeco Ryans said “Our guys moved the ball really well”. Sunday's 30 points, eight long gains and no giveaways support him. The 34 allowed, including Dallas's late 74-yard touchdown drive, explain why that praise did not become a win. Jaylin Noel's 53-yard kickoff return helped Houston score in the third quarter; that shorter job belongs to the return unit, not a defensive stop. All three season defensive takeaways came in Week 3. The Texans cannot schedule another batch of those and call it the recovery plan.
After opponent punts or failed fourth downs, Texans possessions have begun at their own 21.0, on average, across 14 competitive drives. The weekly average has varied widely, from their own 15.0 to their own 28.0. The latest game averaged their own 15.0. The resulting possession started at midfield or closer to the end zone in 0 of those 14 cases. These are actual starting spots, including punt returns, rather than a measure of the defense alone. The return unit has added 51 punt-return yards over the season. Pre-snap changes before the first run or pass affected 2 of these drives; those changes are excluded from the listed starting spots. Starts following turnovers are counted separately: 3 competitive possessions at their own 35.7 on average.
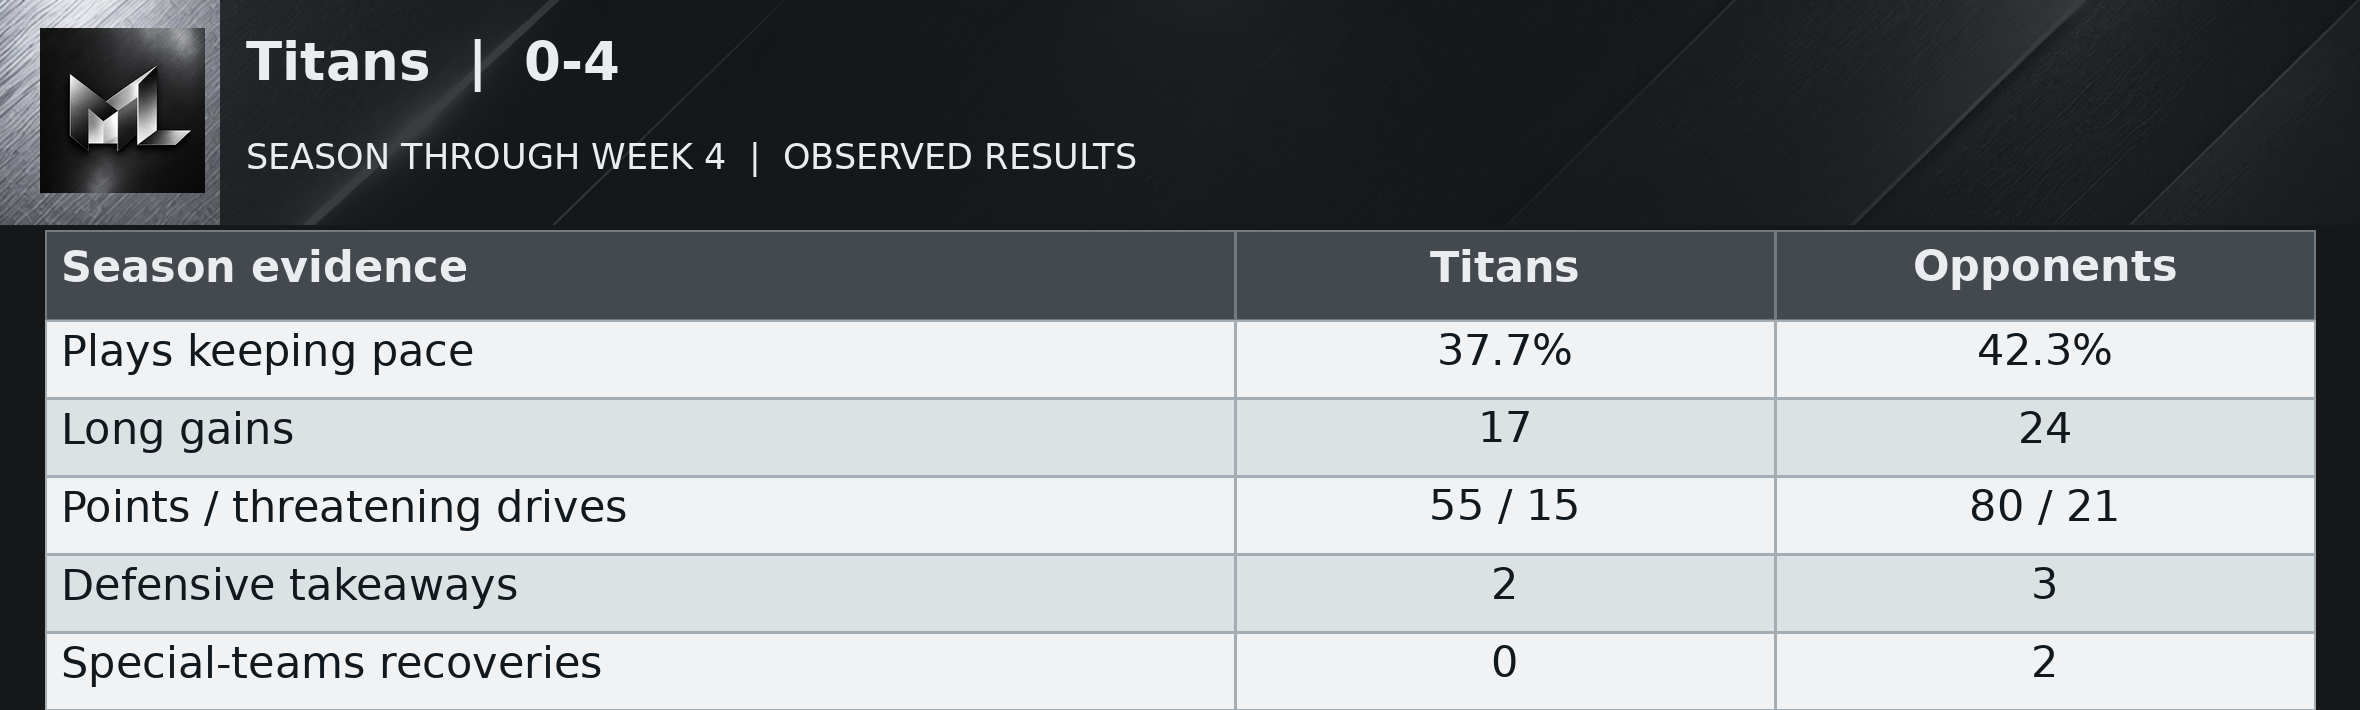
Titans | 0-4
Read the table as text
| Season evidence | Titans | Opponents |
|---|---|---|
| Plays keeping pace | 37.7% | 42.3% |
| Long gains | 17 | 24 |
| Points / threatening drives | 55 / 15 | 80 / 21 |
| Defensive takeaways | 2 | 3 |
| Special-teams recoveries | 0 | 2 |
Tennessee's offense has struggled to sustain movement in every game, with useful-play shares of 42.9, 37.3, 35.1 and 36.2 percent. It has created only 15 threatening possessions and produced 55 points from them. Opponents have generated 21 and returned 80. That gap exists even though the Titans have kept several scores close. Their five team giveaways include two special-teams mistakes, leaving three outside the return units. Both defensive takeaways came in Week 2, so extra possessions have not been a weekly resource.
The 24-18 loss at Baltimore provided five long gains and Carnell Tate's 145 receiving yards, but another two giveaways and a failed goal-line attempt interrupted the promise. Lamar Jackson's departure gave Tennessee a scoreless opponent after halftime; the Titans still could not erase the deficit. The late touchdown made the ending tense without solving the possessions that preceded it. At 0-4, Tennessee's repeated problem is creating and completing enough worthwhile drives. One receiver finding room does not make the rest of the offense dependable.
After opponent punts or failed fourth downs, Titans possessions have begun at their own 19.6, on average, across 17 competitive drives. The weekly average has stayed in a fairly narrow band, from their own 16.0 to their own 24.5. The latest game averaged their own 16.0. The resulting possession started at midfield or closer to the end zone in 0 of those 17 cases. These are actual starting spots, including punt returns, rather than a measure of the defense alone. The return unit has added 62 punt-return yards over the season. Starts following turnovers are counted separately: 2 competitive possessions at their opponent 46.5 on average.
Vikings | 4-0
Read the table as text
| Season evidence | Vikings | Opponents |
|---|---|---|
| Plays keeping pace | 32.2% | 30.8% |
| Long gains | 17 | 23 |
| Points / threatening drives | 79 / 18 | 51 / 19 |
| Defensive takeaways | 7 | 2 |
| Special-teams recoveries | 0 | 0 |
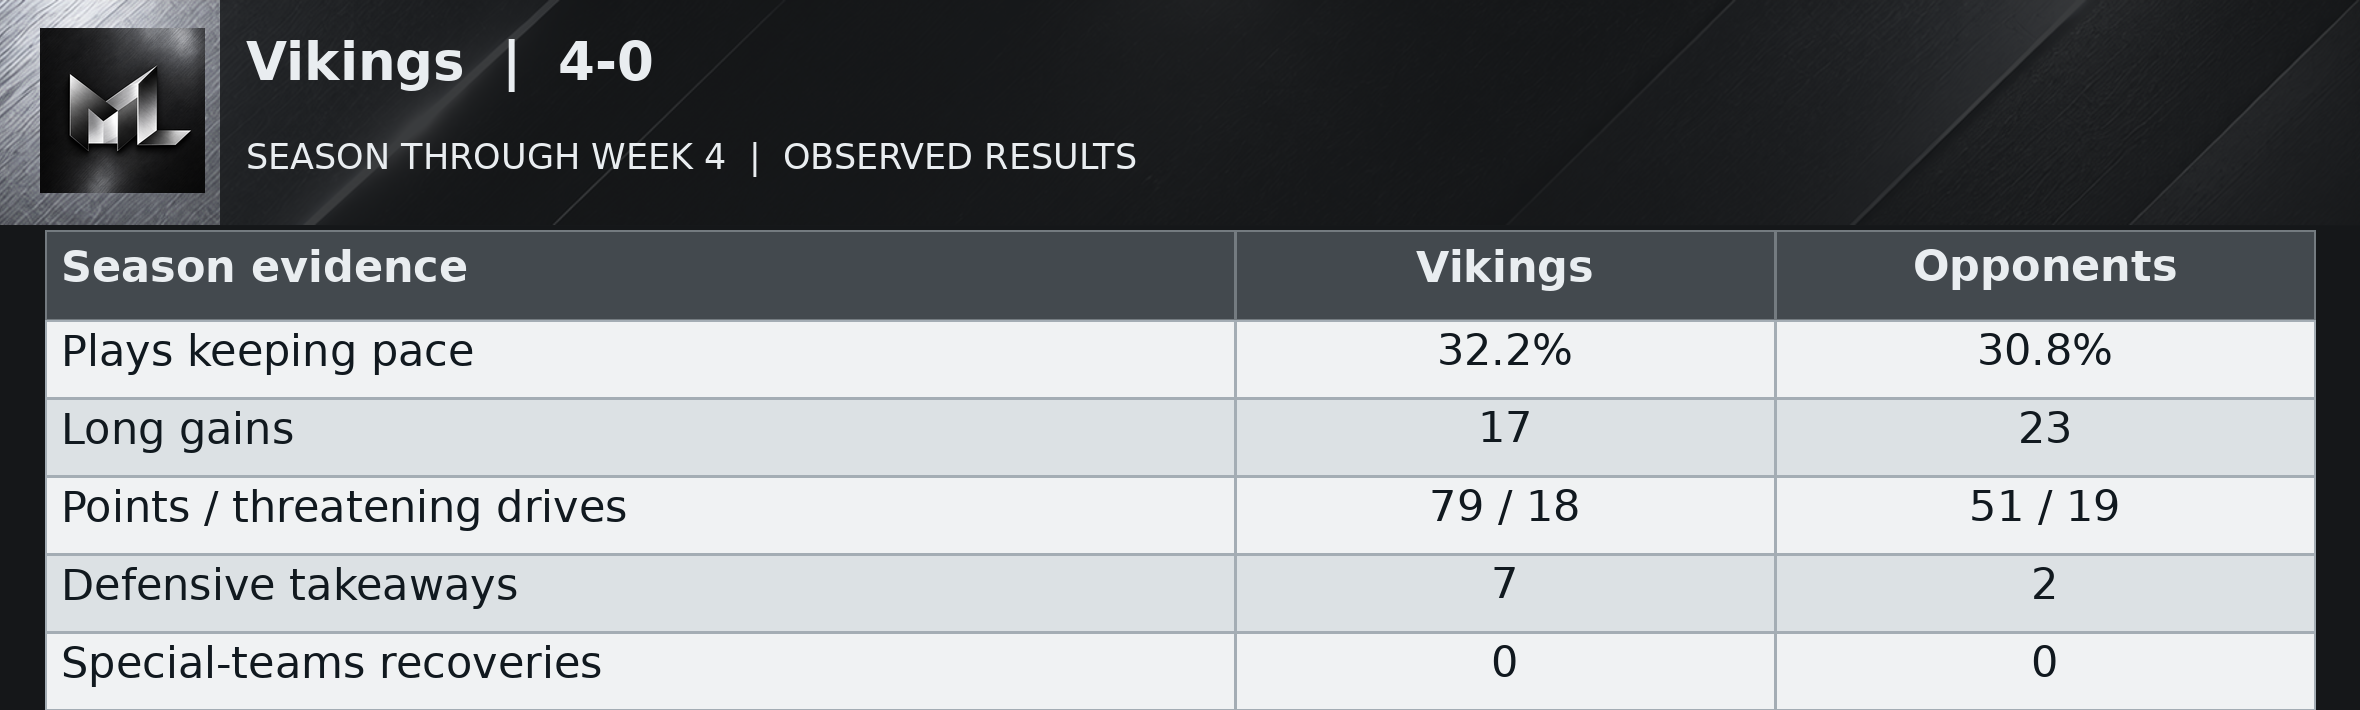
Minnesota is 4-0 with the clearest split between reliable defensive work and unreliable offensive movement. Opponents have made useful gains on only 30.8 percent of their plays and collected 51 offensive points from 19 threatening possessions. The defense has taken the ball away in every game, seven times overall, with no special-teams recoveries in that total. The offense has protected the ball, giving it away twice, but has kept pace with the down on only 32.2 percent of plays.
Kevin O'Connell said “we should do it earlier”. That is a reasonable response to another win without a touchdown. The weekly offensive totals have fallen from 39 to nine to 16 to 15, with a defensive score adding to the Week 3 scoreboard. T.J. Hockenson's late slide Sunday correctly protected the win; it did not explain the possessions before it. Six long gains helped an offense that still spent much of the game searching for normal progress. The defense has earned its undefeated record. The offense has earned a separate conversation.
After opponent punts or failed fourth downs, Vikings possessions have begun at their own 22.7, on average, across 22 competitive drives. The weekly average has varied widely, from their own 17.6 to their own 28.3. The latest game averaged their own 28.3. The resulting possession started at midfield or closer to the end zone in 1 of those 22 cases. These are actual starting spots, including punt returns, rather than a measure of the defense alone. The return unit has added 181 punt-return yards over the season. Pre-snap changes before the first run or pass affected 2 of these drives; those changes are excluded from the listed starting spots. Starts following turnovers are counted separately: 6 competitive possessions at their opponent 45.0 on average.