
Tennessee Titans at Indianapolis Colts
2026-10-18 · 12:00 PM CT · Scheduled


ESPN standings data retrieved October 6, 2026. 2026 season totals at this snapshot.
| Measure | Tennessee Titans | Indianapolis Colts |
|---|---|---|
| Record | 0-4 | 2-2 |
| Points scored / game | 13.8 | 25.5 |
| Points allowed / game | 20.8 | 26.0 |
| Points differential | -28 | -2 |
| Home record | 0-2 | 1-1 |
| Road record | 0-2 | 1-1 |
How this game can be won
Tennessee Titans average 13.8 points scored and 20.8 allowed; Indianapolis Colts average 25.5 scored and 26.0 allowed. The first question is whether each offense can make ordinary downs useful. Repeated manageable gains keep more of the playbook available.
Watch the long gains separately. An offense can move steadily without breaking a big play, or spend an afternoon waiting for one big play to rescue it. The more repeatable approach is the one that can still move the ball when the defense removes its easiest option.
Field position changes the job. Starting near midfield means fewer yards are needed before a scoring chance. Once the drive reaches threatening territory, watch whether the offense finishes it with useful points instead of wasting the trip.
Finally, count the lost possessions. Turnovers can change a close game without explaining every down that came before them. Our football model needs efficiency, explosive-play rate, starting field position, drive finishing and turnover margin together. A scoring average or a third-down rate cannot replace that set.
Closer to game day
Spreads and win probabilities are reserved for confirmed games within the next seven days. This game stays on the schedule; its forecast opens inside that window.
Tennessee Titans · our 2026-10-06 assessment
Titans | 0-4
Read the table as text
| Season evidence | Titans | Opponents |
|---|---|---|
| Plays keeping pace | 37.7% | 42.3% |
| Long gains | 17 | 24 |
| Points / threatening drives | 55 / 15 | 80 / 21 |
| Defensive takeaways | 2 | 3 |
| Special-teams recoveries | 0 | 2 |
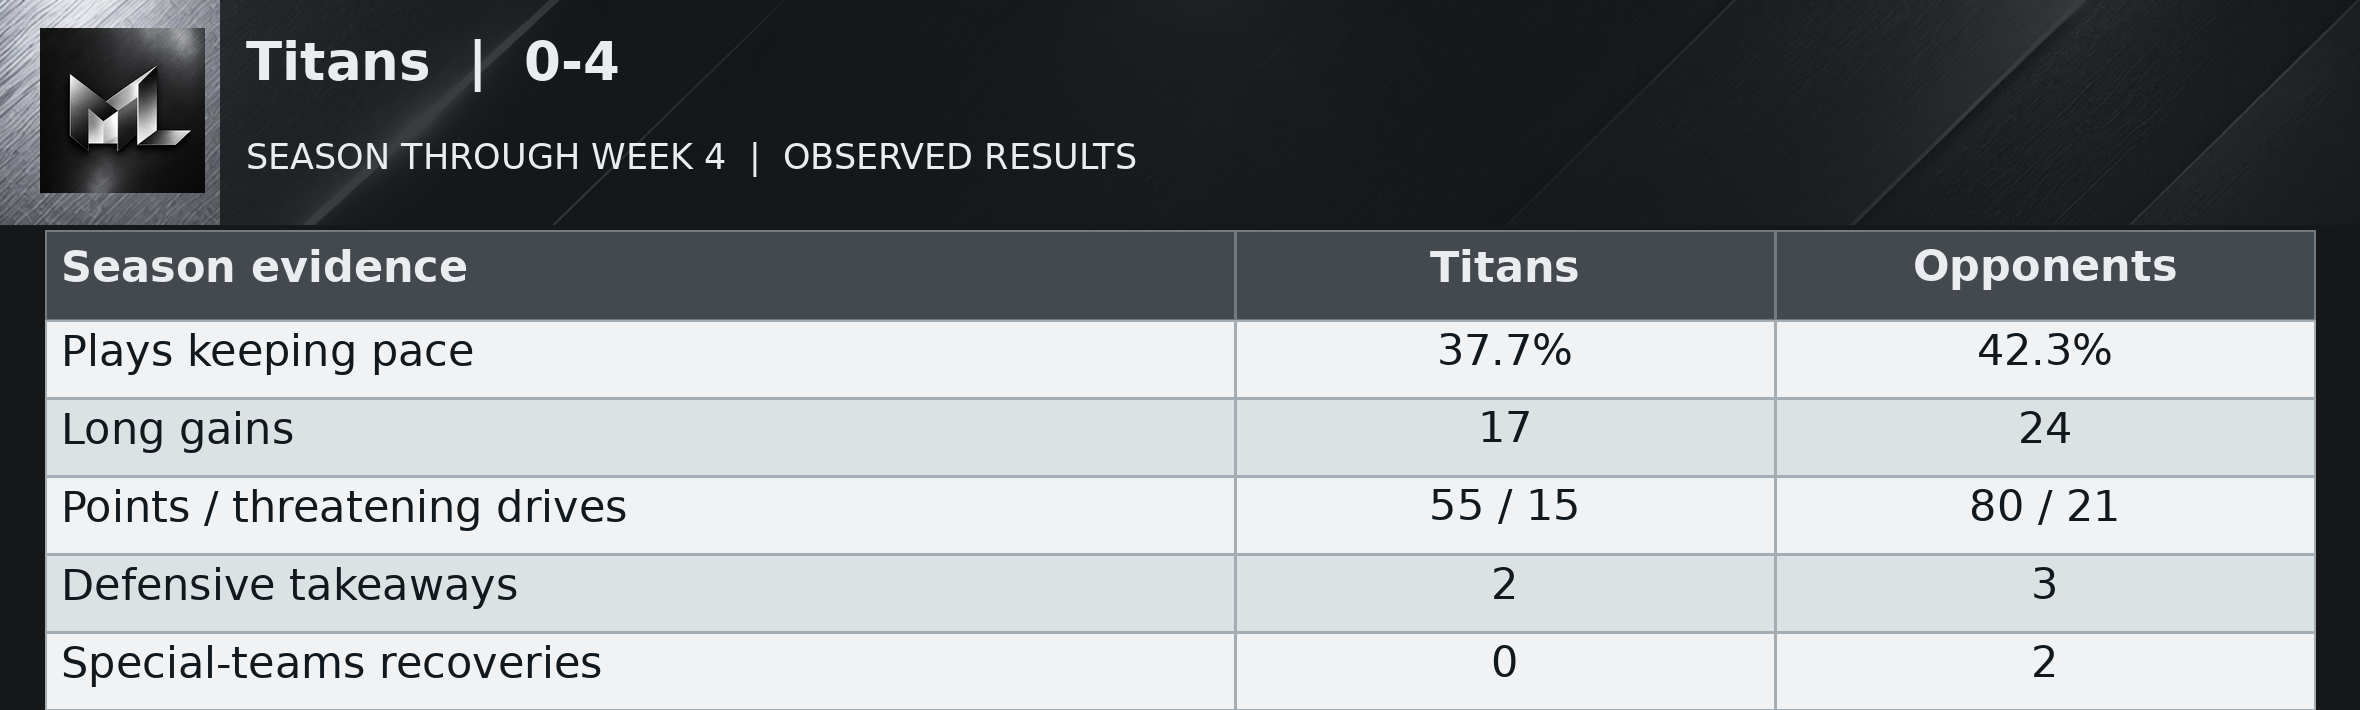
Tennessee's offense has struggled to sustain movement in every game, with useful-play shares of 42.9, 37.3, 35.1 and 36.2 percent. It has created only 15 threatening possessions and produced 55 points from them. Opponents have generated 21 and returned 80. That gap exists even though the Titans have kept several scores close. Their five team giveaways include two special-teams mistakes, leaving three outside the return units. Both defensive takeaways came in Week 2, so extra possessions have not been a weekly resource.
The 24-18 loss at Baltimore provided five long gains and Carnell Tate's 145 receiving yards, but another two giveaways and a failed goal-line attempt interrupted the promise. Lamar Jackson's departure gave Tennessee a scoreless opponent after halftime; the Titans still could not erase the deficit. The late touchdown made the ending tense without solving the possessions that preceded it. At 0-4, Tennessee's repeated problem is creating and completing enough worthwhile drives. One receiver finding room does not make the rest of the offense dependable.
After opponent punts or failed fourth downs, Titans possessions have begun at their own 19.6, on average, across 17 competitive drives. The weekly average has stayed in a fairly narrow band, from their own 16.0 to their own 24.5. The latest game averaged their own 16.0. The resulting possession started at midfield or closer to the end zone in 0 of those 17 cases. These are actual starting spots, including punt returns, rather than a measure of the defense alone. The return unit has added 62 punt-return yards over the season. Starts following turnovers are counted separately: 2 competitive possessions at their opponent 46.5 on average.
Indianapolis Colts · our 2026-10-06 assessment
Colts | 2-2
Read the table as text
| Season evidence | Colts | Opponents |
|---|---|---|
| Plays keeping pace | 43.0% | 44.0% |
| Long gains | 23 | 25 |
| Points / threatening drives | 102 / 24 | 104 / 26 |
| Defensive takeaways | 2 | 8 |
| Special-teams recoveries | 0 | 0 |
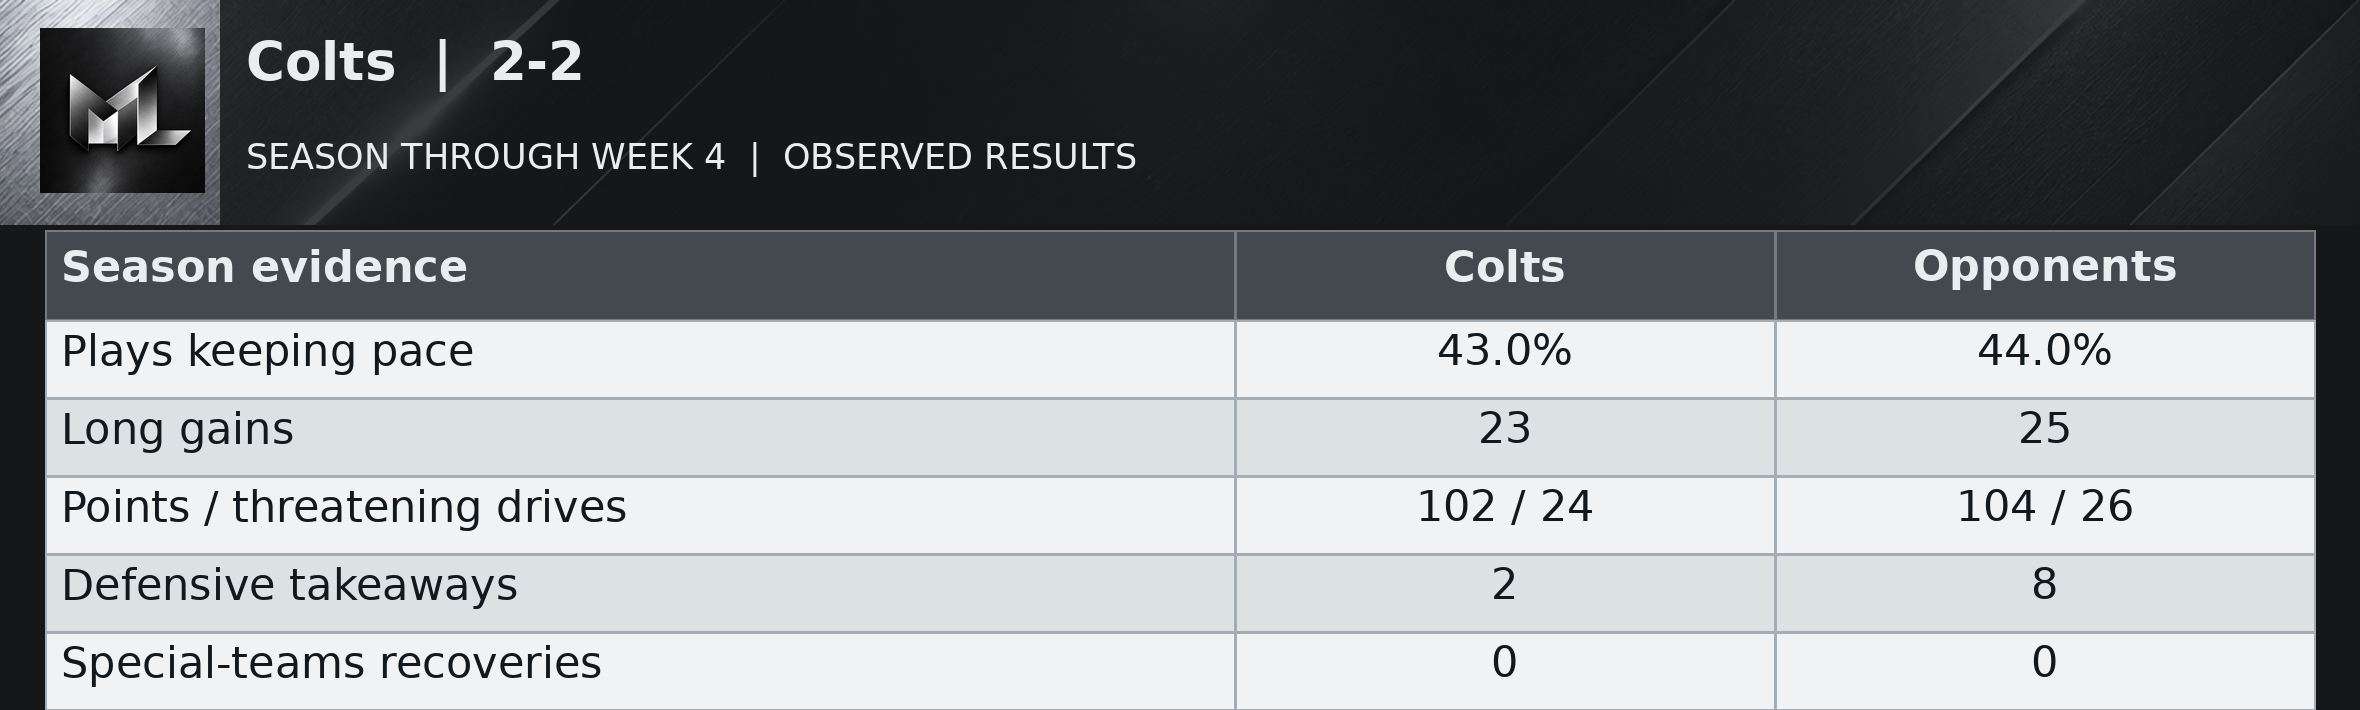
Indianapolis has been fairly consistent at moving the ball and remarkably consistent at putting that movement at risk. Its weekly useful-play shares have stayed between 40.6 and 46.0 percent. Its giveaways have run two, one, three and two. The Colts have eight giveaways against just two defensive takeaways, meaning the two-game winning streak has not repaired their most repeated possession problem. Their defense has also allowed 104 offensive points from 26 threatening possessions, close to the offense's 102 from 24.
Daniel Jones said “Can’t afford to turn the ball over like that”. He had just won 30-13 while contributing both of Sunday's giveaways. The scoreboard does not repeal his statement. Jonathan Taylor's 95 rushing yards and two touchdowns helped restore order, and an interception handed Indianapolis a 20-yard touchdown possession. The other offensive work still mattered, especially the answer after Washington cut the lead to four. At 2-2, the Colts have evidence of resilience and very little evidence that the turnover problem has stopped.
After opponent punts or failed fourth downs, Colts possessions have begun at their own 26.4, on average, across 20 competitive drives. The weekly average has varied widely, from their own 10.2 to their own 36.1. The latest game averaged their own 36.1. The resulting possession started at midfield or closer to the end zone in 2 of those 20 cases. These are actual starting spots, including punt returns, rather than a measure of the defense alone. The return unit has added 25 punt-return yards over the season. Starts following turnovers are counted separately: 2 competitive possessions at their opponent 17.5 on average.
Our coverage of these teams
A matching published game video is not available in the verified archive yet.