
Philadelphia Eagles at Jacksonville Jaguars
2026-10-11 · 8:30 AM CT · Scheduled · neutral site · NFL London Games
ESPN standings data retrieved October 6, 2026. 2026 season totals at this snapshot.
| Measure | Philadelphia Eagles | Jacksonville Jaguars |
|---|---|---|
| Record | 2-2 | 3-1 |
| Points scored / game | 18.8 | 26.0 |
| Points allowed / game | 23.2 | 13.2 |
| Points differential | -18 | +51 |
| Home record | 1-1 | 2-0 |
| Road record | 1-1 | 1-1 |
How this game can be won
Philadelphia Eagles average 18.8 points scored and 23.2 allowed; Jacksonville Jaguars average 26.0 scored and 13.2 allowed. The first question is whether each offense can make ordinary downs useful. Repeated manageable gains keep more of the playbook available.
Watch the long gains separately. An offense can move steadily without breaking a big play, or spend an afternoon waiting for one big play to rescue it. The more repeatable approach is the one that can still move the ball when the defense removes its easiest option.
Field position changes the job. Starting near midfield means fewer yards are needed before a scoring chance. Once the drive reaches threatening territory, watch whether the offense finishes it with useful points instead of wasting the trip.
Finally, count the lost possessions. Turnovers can change a close game without explaining every down that came before them. Our football model needs efficiency, explosive-play rate, starting field position, drive finishing and turnover margin together. A scoring average or a third-down rate cannot replace that set.
Our matchup simulation
nflverse 2026 play-by-play, regular-season Weeks 1–4. We apply the Lab measures, fit their relationship to the scoring margin, then sample possible results from the scoring errors observed in completed games.
 Philadelphia Eagles43.3%
 Jacksonville Jaguars56.7%
Standard deviation shows how widely the simulated scoring margins vary. A larger number means a less steady outcome; it is not the error bar on the win percentage.
Philadelphia EaglesJacksonville Jaguars
Where the factor edge comes from
| Lab measure | Weight | Home − away · z | Baseline margin effect |
|---|---|---|---|
| Efficiency | 40% | +1.95 | +0.7 pts |
| Explosiveness | 25% | +0.49 | +0.1 pts |
| Field position | 10% | -1.77 | -0.2 pts |
| Finishing drives | 15% | +2.44 | +0.3 pts |
| Turnovers | 10% | +2.78 | +0.3 pts |
Positive effects favor Jacksonville Jaguars; negative effects favor Philadelphia Eagles. Both offense and defense enter the net factors. Home-court / field term +0.0 points. These effects explain the fitted baseline; the simulation also varies its fitted coefficients and game outcomes.
Model inputs, variability and validation
Four games per team; league-average play/drive priors retained. Established NFL editorial weights 40/25/10/15/10 percent. Profiles use Completed Week 4, October 5, 2026. Historical calibration uses only each game’s earlier factor data; 48 completed games fit the margin and home advantage.
Chronological check 16 held-out games; margin RMSE 9.1 points; Brier score 0.254 (50/50 baseline 0.250; lower is better). The final fit then uses all available earlier games. This check is not proof of future calibration.
Outcome noise resamples observed scoring-margin errors, preserving the shape of the available results instead of imposing a bell curve. Bootstrap fits capture some uncertainty in the fitted coefficients. Between-batch win-rate standard deviation 3.7 percentage points. Monte Carlo sampling standard error 0.16 percentage points applies to the unsplit positive-margin frequency; it excludes model error. Zero-margin trials (1.5%) are split equally to estimate the final winner. That is an explicit overtime assumption, not a modeled overtime system.
Injuries, starting lineup changes, rest, travel and postseason rotation changes are not adjusted. The model uses no market odds. Forecast snapshot October 6 at 10:49 AM CT; only confirmed regular-season or playoff games in the following seven days qualify.
Philadelphia Eagles · our 2026-10-06 assessment
Eagles | 2-2
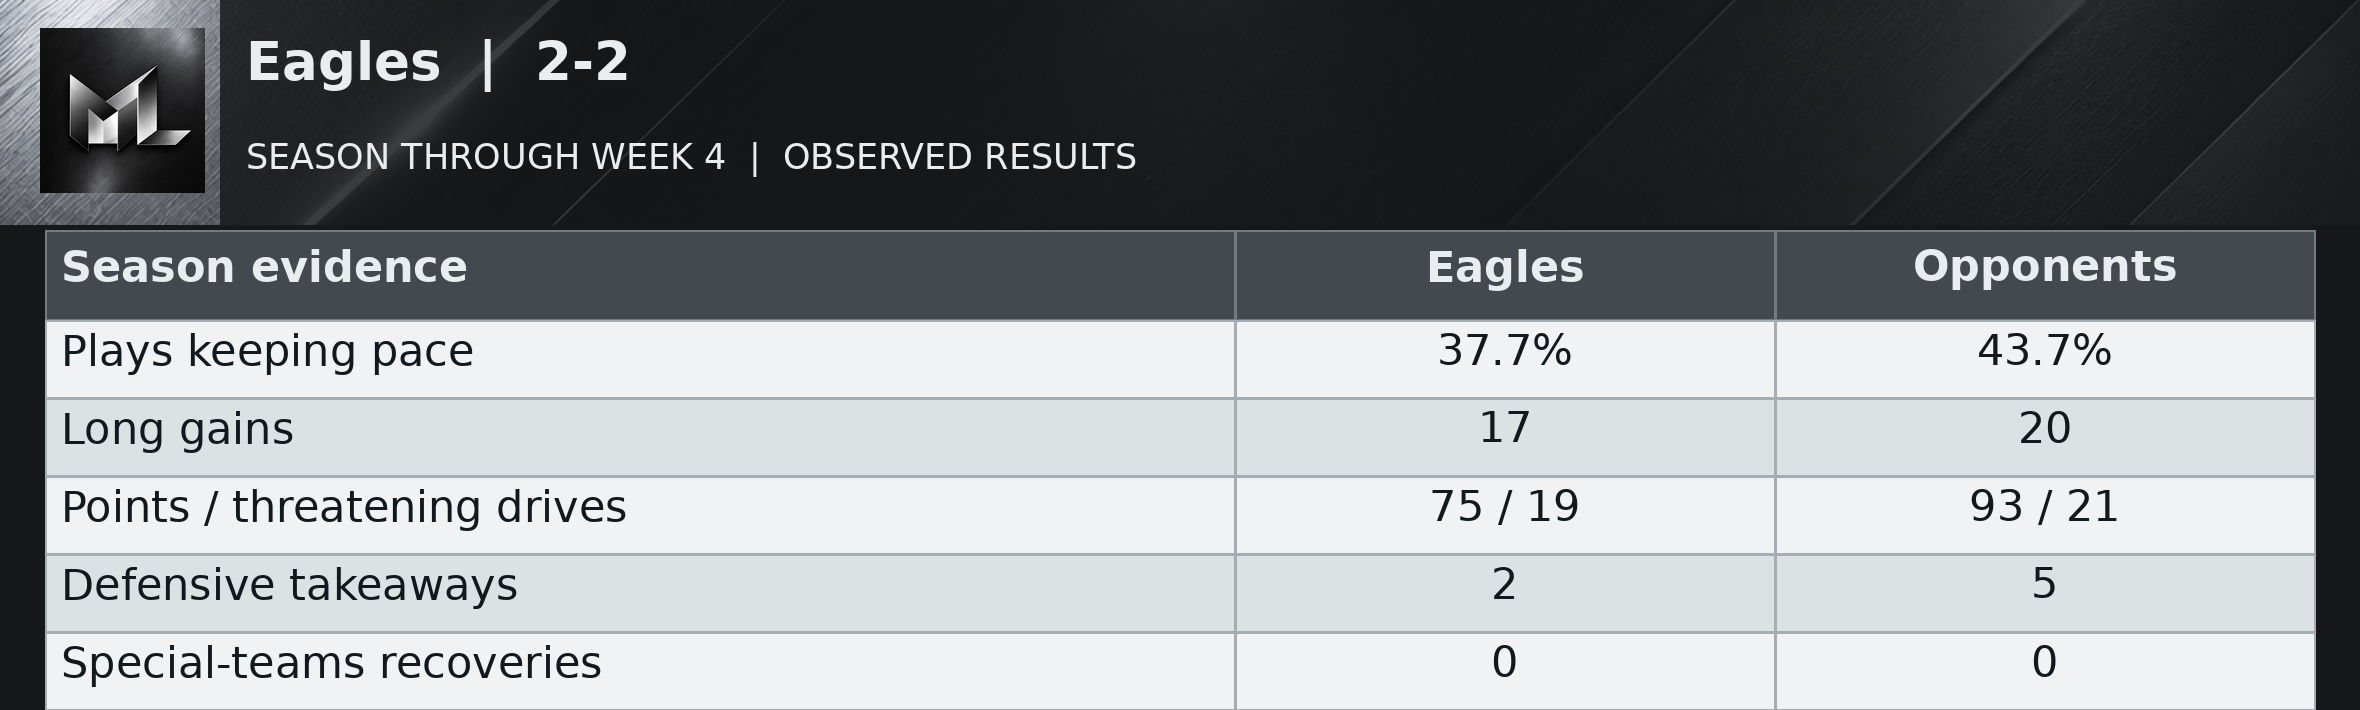
Read the table as text
| Season evidence | Eagles | Opponents |
|---|---|---|
| Plays keeping pace | 37.7% | 43.7% |
| Long gains | 17 | 20 |
| Points / threatening drives | 75 / 19 | 93 / 21 |
| Defensive takeaways | 2 | 5 |
| Special-teams recoveries | 0 | 0 |
Philadelphia's offense has been unreliable throughout a 2-2 start, keeping up with the down on only 37.7 percent of plays. Its useful-play share actually rose in the Week 3 loss before collapsing to 31.0 percent Sunday, a reminder that moving the ball and cashing in are separate questions. Five giveaways in Weeks 2 and 3 created another problem, but Sunday was clean. The defense finally collected its first two takeaways, yet the team still lost 24-20.
Jalen Hurts called it “Poor execution”. Zero third-down conversions in 12 attempts and 172 total yards leave little to dispute. Two interceptions set up 10 first-half points, but the offense then failed to protect a 10-point lead. The decision to reject a short field goal on fourth down removed a chance to make it a 13-point margin and handed the Rams a possession that became a 98-yard touchdown march. A defense can provide territory and chances. Philadelphia still has to use them.
After opponent punts or failed fourth downs, Eagles possessions have begun at their own 30.1, on average, across 18 competitive drives. The weekly average has varied widely, from their own 17.7 to their own 38.0. The latest game averaged their own 38.0. The resulting possession started at midfield or closer to the end zone in 1 of those 18 cases. These are actual starting spots, including punt returns, rather than a measure of the defense alone. The return unit has added 136 punt-return yards over the season. Pre-snap changes before the first run or pass affected 2 of these drives; those changes are excluded from the listed starting spots. Starts following turnovers are counted separately: 2 competitive possessions at their opponent 31.5 on average.
Jacksonville Jaguars · our 2026-10-06 assessment
Jaguars | 3-1
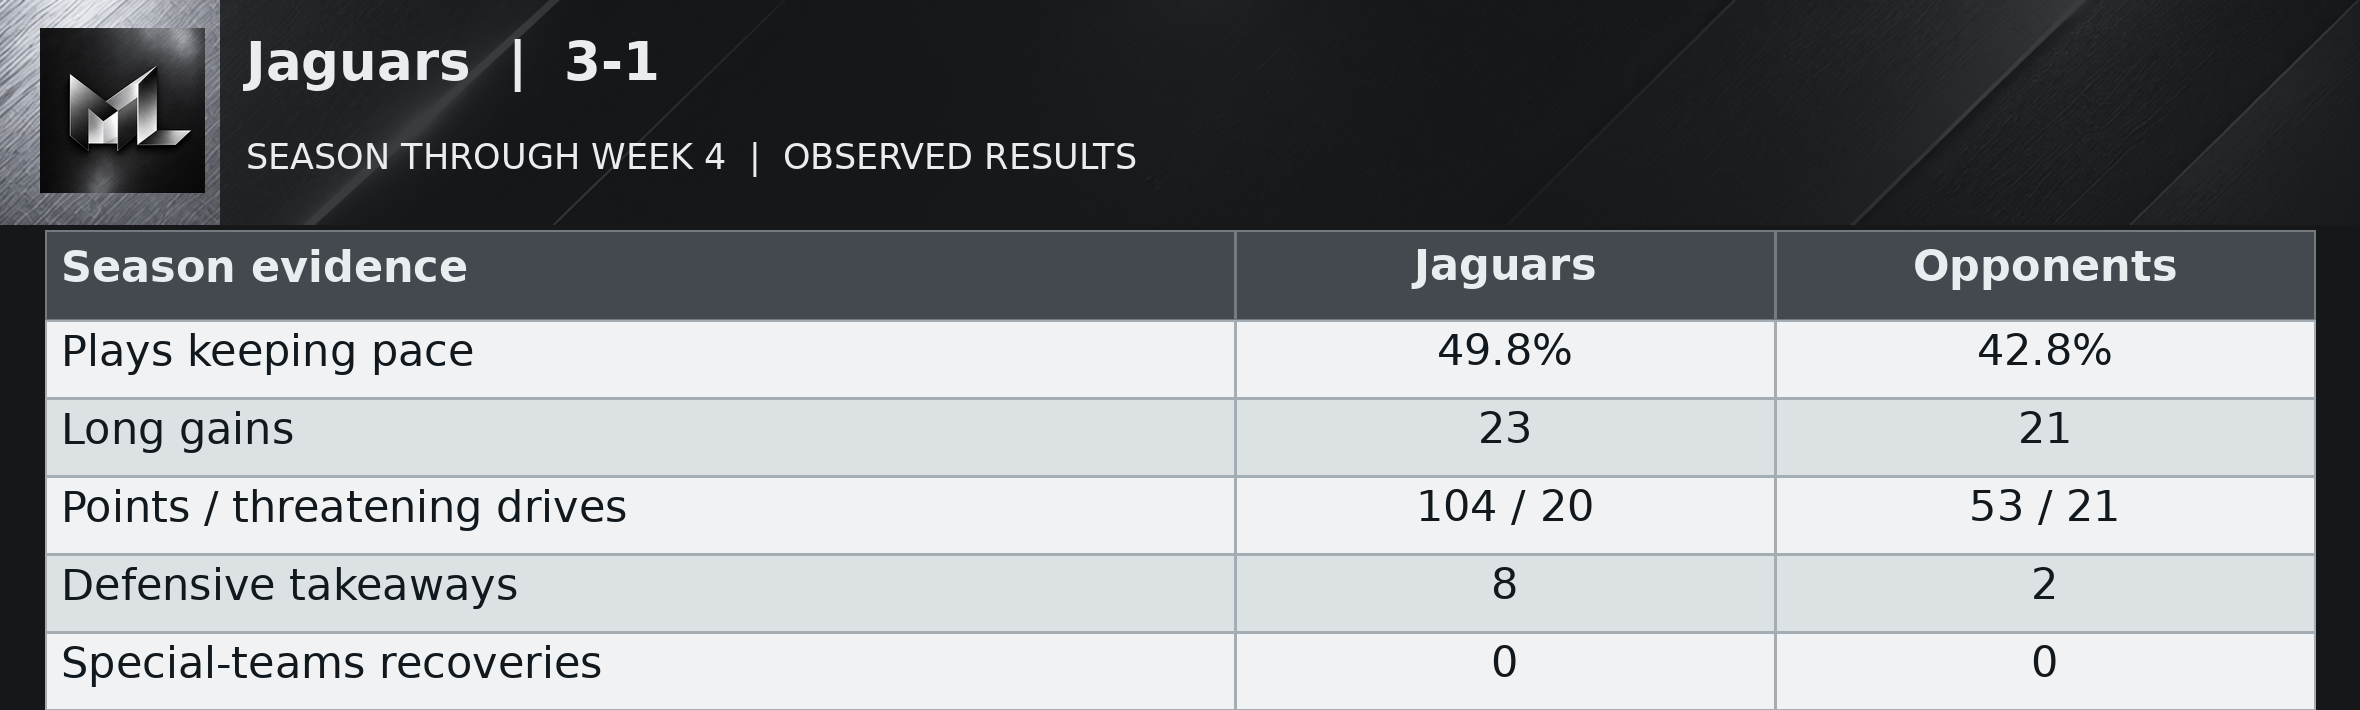
Read the table as text
| Season evidence | Jaguars | Opponents |
|---|---|---|
| Plays keeping pace | 49.8% | 42.8% |
| Long gains | 23 | 21 |
| Points / threatening drives | 104 / 20 | 53 / 21 |
| Defensive takeaways | 8 | 2 |
| Special-teams recoveries | 0 | 0 |
Jacksonville has blended three dependable advantages: very few giveaways, repeated defensive takeaways and strong resistance when opponents threaten to score. Its opponents have collected only 53 offensive points from 21 threatening drives, while Jacksonville has returned 104 from 20. All eight takeaways were defensive plays, and the offense has given the ball away only twice. That combination explains a 3-1 start more convincingly than treating the latest 22-17 win as a stand-alone escape.
The offense still changes considerably from week to week. Its useful gains ranged from 43.6 to 60.4 percent of plays, and Sunday's 44.2 percent was closer to the lower end. Trevor Lawrence said “You’re going to have to win games like this”. True, but the defense cannot be the answer to every stalled possession. Jacksonville added six long gains Sunday after only three in the previous win. Its strongest season habit is protecting and recovering possession; maintaining ordinary progress would make the narrow finishes less necessary.
After opponent punts or failed fourth downs, Jaguars possessions have begun at their own 23.6, on average, across 12 competitive drives. The weekly average has varied widely, from their own 19.0 to their own 31.3. The latest game averaged their own 21.5. The resulting possession started at midfield or closer to the end zone in 0 of those 12 cases. These are actual starting spots, including punt returns, rather than a measure of the defense alone. The return unit has added 15 punt-return yards over the season. Starts following turnovers are counted separately: 8 competitive possessions at their own 45.9 on average.
Our coverage of these teams
A matching published game video is not available in the verified archive yet.