
New Orleans Saints at New York Giants
2026-10-18 · 12:00 PM CT · Scheduled


ESPN standings data retrieved October 6, 2026. 2026 season totals at this snapshot.
| Measure | New Orleans Saints | New York Giants |
|---|---|---|
| Record | 1-3 | 3-1 |
| Points scored / game | 26.2 | 20.5 |
| Points allowed / game | 32.0 | 19.8 |
| Points differential | -23 | +3 |
| Home record | 0-2 | 3-0 |
| Road record | 1-1 | 0-1 |
How this game can be won
New Orleans Saints average 26.2 points scored and 32.0 allowed; New York Giants average 20.5 scored and 19.8 allowed. The first question is whether each offense can make ordinary downs useful. Repeated manageable gains keep more of the playbook available.
Watch the long gains separately. An offense can move steadily without breaking a big play, or spend an afternoon waiting for one big play to rescue it. The more repeatable approach is the one that can still move the ball when the defense removes its easiest option.
Field position changes the job. Starting near midfield means fewer yards are needed before a scoring chance. Once the drive reaches threatening territory, watch whether the offense finishes it with useful points instead of wasting the trip.
Finally, count the lost possessions. Turnovers can change a close game without explaining every down that came before them. Our football model needs efficiency, explosive-play rate, starting field position, drive finishing and turnover margin together. A scoring average or a third-down rate cannot replace that set.
Closer to game day
Spreads and win probabilities are reserved for confirmed games within the next seven days. This game stays on the schedule; its forecast opens inside that window.
New Orleans Saints · our 2026-10-06 assessment
Saints | 1-3
Read the table as text
| Season evidence | Saints | Opponents |
|---|---|---|
| Plays keeping pace | 43.3% | 52.3% |
| Long gains | 21 | 26 |
| Points / threatening drives | 105 / 22 | 128 / 26 |
| Defensive takeaways | 2 | 8 |
| Special-teams recoveries | 1 | 0 |
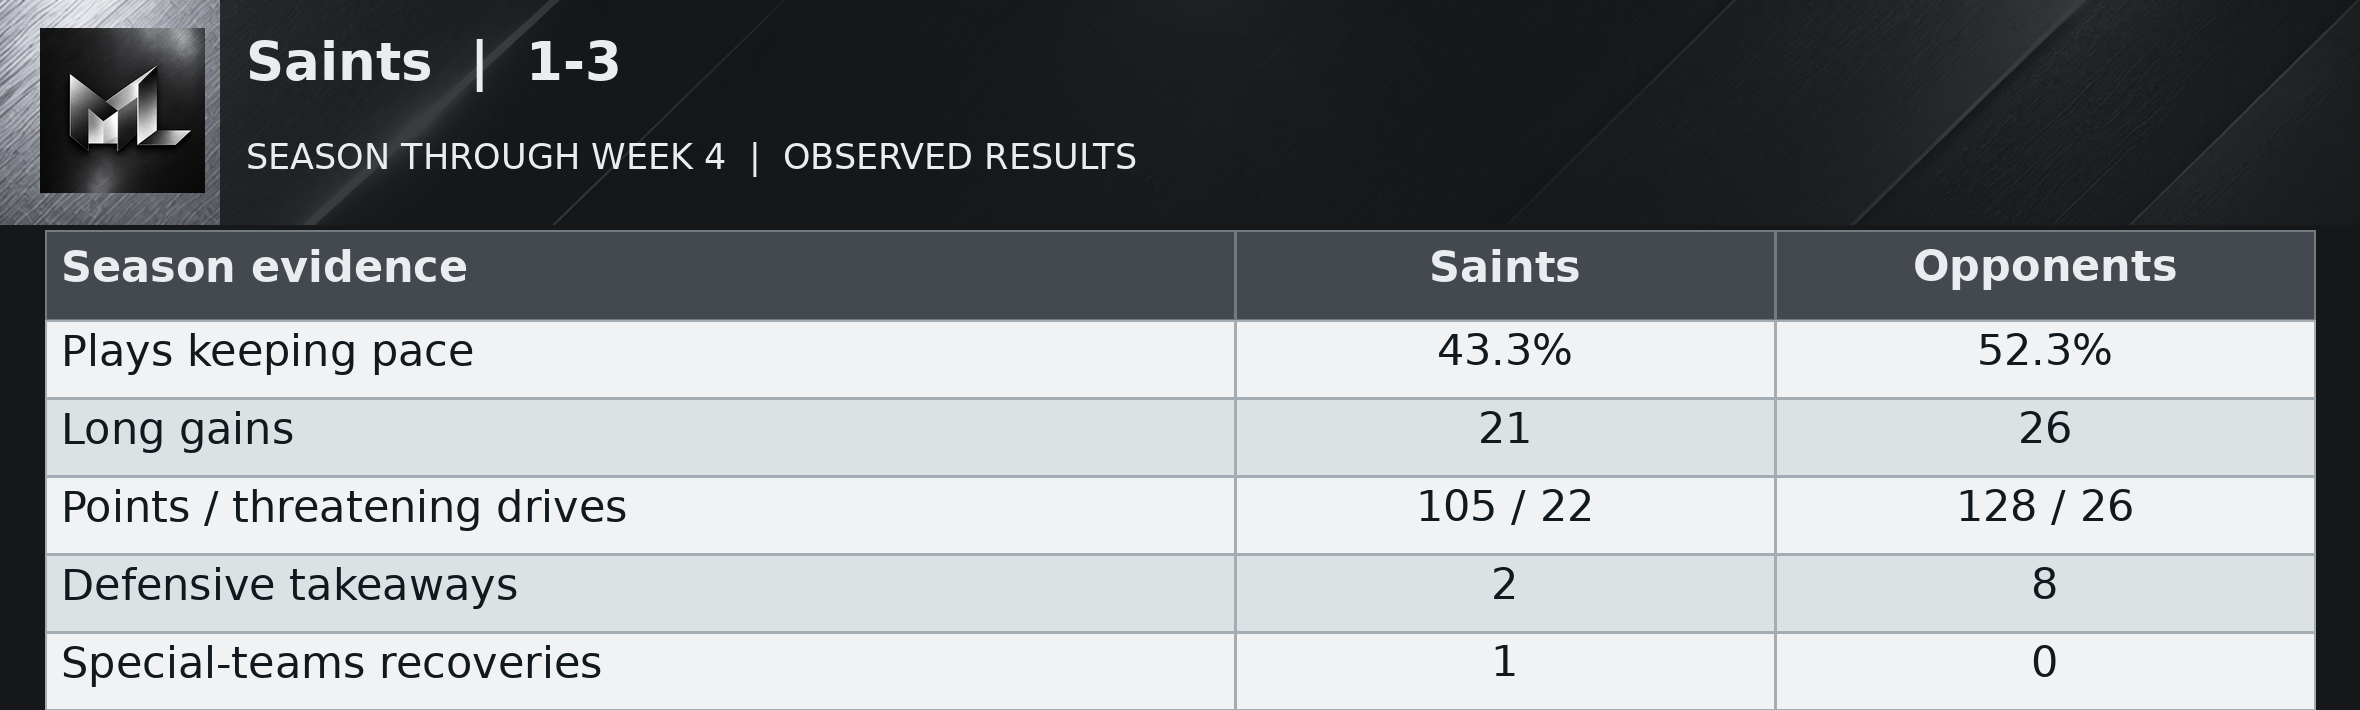
New Orleans has repeatedly allowed opponents to move and finish with less resistance than its own offense receives. Opponents have made useful gains on 52.3 percent of plays, against the Saints' 43.3, and taken 128 offensive points from 26 threatening drives. The Saints have returned 105 from 22. Their offensive movement peaked in Week 3 but came with four giveaways. Monday brought fewer mistakes and still a 45-24 defeat, so possession alone does not explain the season's defensive problem.
Tyler Shough called the performance “embarrassing”. Allowing 205 rushing yards while producing 50, then watching Atlanta score on eight threatening possessions, gives the word numerical support. Kendre Miller's fumble created an early short field, and defensive holding extended the resulting touchdown drive. Those were two distinct forms of assistance. Only two of New Orleans's three team takeaways came from the defense; the other was on special teams. Eight giveaways, all outside special teams, have repeatedly added pressure to a defense already struggling without that help.
After opponent punts or failed fourth downs, Saints possessions have begun at their own 23.1, on average, across 15 competitive drives. The weekly average has varied widely, from their own 16.5 to their own 29.3. The latest game averaged their own 16.5. The resulting possession started at midfield or closer to the end zone in 0 of those 15 cases. These are actual starting spots, including punt returns, rather than a measure of the defense alone. The return unit has added 47 punt-return yards over the season. Pre-snap changes before the first run or pass affected 2 of these drives; those changes are excluded from the listed starting spots. Starts following turnovers are counted separately: 2 competitive possessions at their opponent 46.0 on average.
New York Giants · our 2026-10-06 assessment
Giants | 3-1
Read the table as text
| Season evidence | Giants | Opponents |
|---|---|---|
| Plays keeping pace | 39.5% | 47.4% |
| Long gains | 15 | 19 |
| Points / threatening drives | 76 / 22 | 76 / 17 |
| Defensive takeaways | 7 | 5 |
| Special-teams recoveries | 1 | 0 |
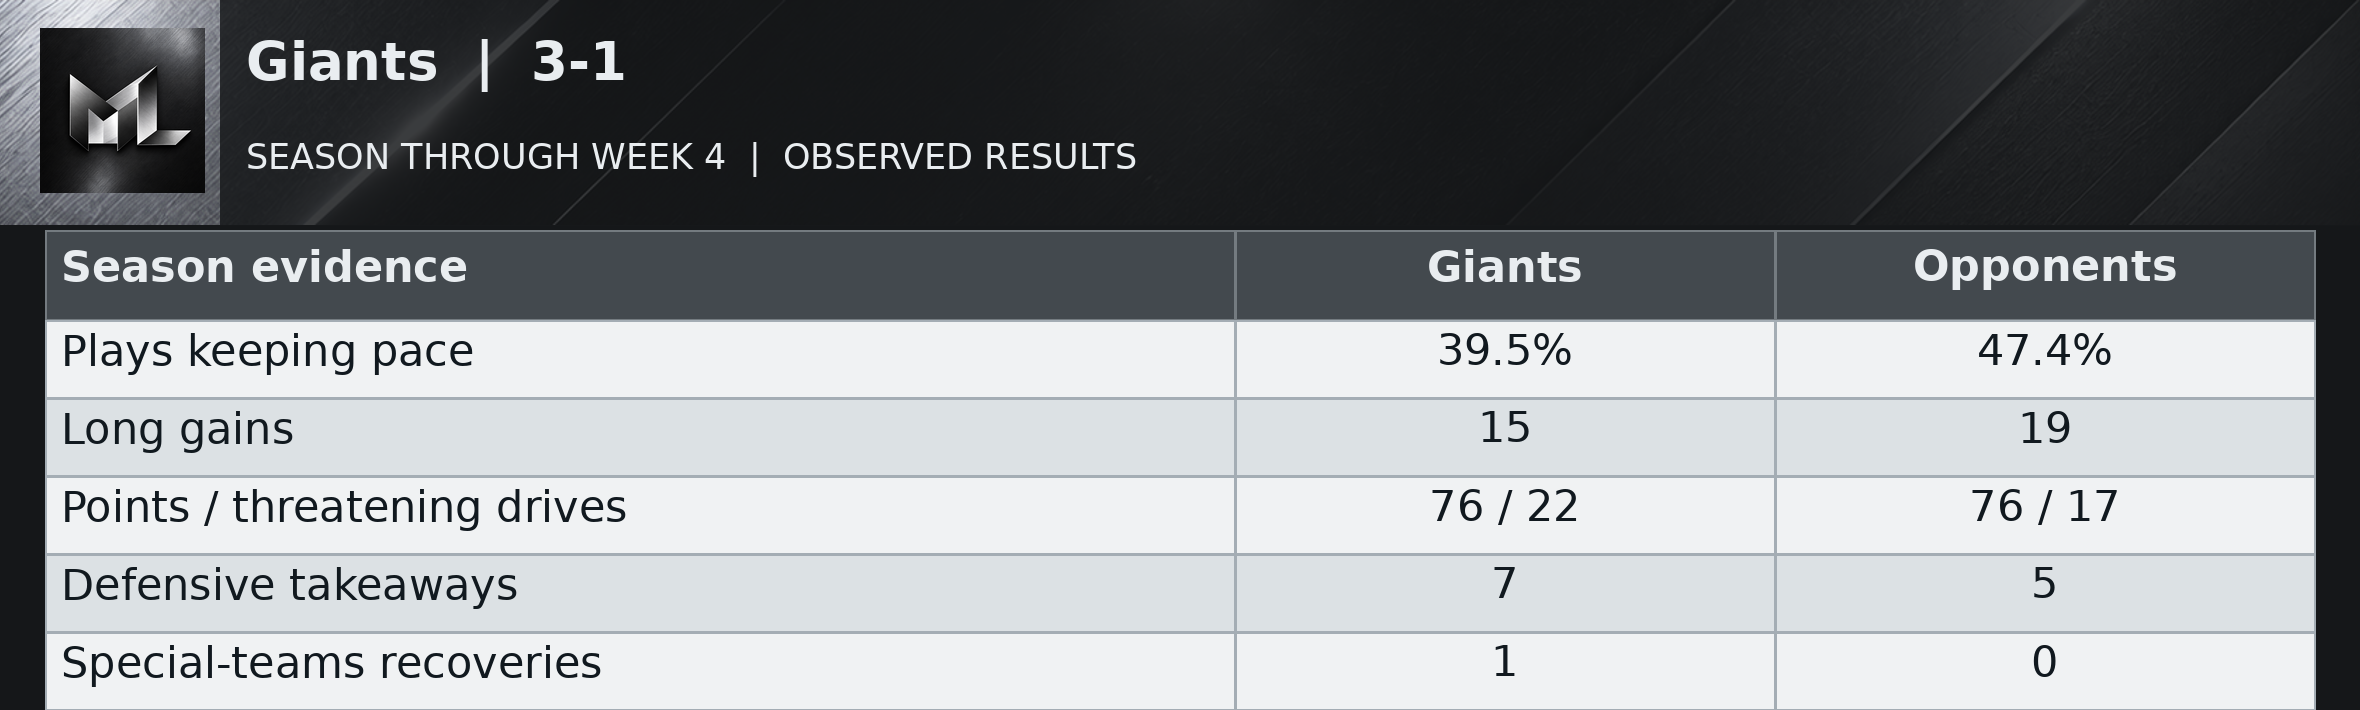
The Giants' 3-1 record sits beside a much shakier offensive season. Their useful-play share fell from 60.0 percent in the opener to 27.3, 36.8 and 31.1. The offense scored six and 12 in the middle two games before producing 30 Sunday, with a defensive touchdown raising the latest scoreboard to 36. Seven of eight season takeaways were defensive. That repeated ability to steal possession has mattered more than the offense's ordinary movement, while five giveaways have complicated the benefit.
John Harbaugh called Sunday “a winning game”. Correct, and incomplete as a diagnosis. The 36-24 result included a 98-yard interception return that sealed the outcome, three interceptions collected overall and three giveaways by New York. A defensive score does not mean the offense finished another drive. The Giants also allowed Arizona two long early touchdown marches before tightening. Finding ways to win is useful. An offense that has struggled between isolated scoring plays for three straight weeks needs more than the record as its defense.
After opponent punts or failed fourth downs, Giants possessions have begun at their own 25.5, on average, across 17 competitive drives. The weekly average has varied widely, from their own 14.0 to their own 35.7. The latest game averaged their own 35.7. The resulting possession started at midfield or closer to the end zone in 1 of those 17 cases. These are actual starting spots, including punt returns, rather than a measure of the defense alone. The return unit has added 41 punt-return yards over the season. Pre-snap changes before the first run or pass affected 2 of these drives; those changes are excluded from the listed starting spots. Starts following turnovers are counted separately: 6 competitive possessions at their opponent 44.7 on average.
Our coverage of these teams
A matching published game video is not available in the verified archive yet.