
Iowa Hawkeyes at Minnesota Golden Gophers
2026-10-23 · Time TBD · Scheduled


ESPN standings data retrieved October 6, 2026. 2026 season totals at this snapshot.
| Measure | Iowa Hawkeyes | Minnesota Golden Gophers |
|---|---|---|
| Record | 4-1 | 4-1 |
| Points scored / game | 29.0 | 32.0 |
| Points allowed / game | 12.6 | 18.0 |
| Points differential | +82 | +70 |
How this game can be won
Iowa Hawkeyes average 29.0 points scored and 12.6 allowed; Minnesota Golden Gophers average 32.0 scored and 18.0 allowed. The first question is whether each offense can make ordinary downs useful. Repeated manageable gains keep more of the playbook available.
Watch the long gains separately. An offense can move steadily without breaking a big play, or spend an afternoon waiting for one big play to rescue it. The more repeatable approach is the one that can still move the ball when the defense removes its easiest option.
Field position changes the job. Starting near midfield means fewer yards are needed before a scoring chance. Once the drive reaches threatening territory, watch whether the offense finishes it with useful points instead of wasting the trip.
Finally, count the lost possessions. Turnovers can change a close game without explaining every down that came before them. Our football model needs efficiency, explosive-play rate, starting field position, drive finishing and turnover margin together. A scoring average or a third-down rate cannot replace that set.
Closer to game day
Spreads and win probabilities are reserved for confirmed games within the next seven days. This game stays on the schedule; its forecast opens inside that window.
Iowa Hawkeyes · our 2026-10-04 assessment
Iowa
4-1 overall | Preview AP No. 14 | Matchup Lab No. 33 | Index 58.8
Iowa's first loss exposed the shrinking separation between its offense and defense. Across its charted FBS games, it now produces successful plays at 40.7 percent and allows 40.3 percent. The defense's weekly allowance has risen from 25.9 and 32.1 percent to 45.6 and 52.1 percent. Those are different opponents, but the direction explains why a previously attractive scoring margin became harder to maintain.
Ohio State's 31-14 win was not simply a turnover story. Iowa lost the ball twice, but was also outgained 484-238 and rushed for only 39 yards. The Buckeyes repeatedly extended drives and averaged 12 yards per pass attempt. Iowa's five third-down conversions on 11 tries did not compensate for the lack of useful rushing production or the damaging gains allowed.
Friday's preview framed Iowa's chance around making Ohio State earn every yard. That standard was not met. Iowa's first four turnover margins were positive or even; Saturday's minus two removed another cushion. With its offensive high-impact-play rate only 4.4 percent in the FBS sample, this team cannot confidently replace stalled drives with sudden scores. It needs field position and defensive stops to create manageable work, then a more dependable running game to complete it.
Across the season, qualifying stops have handed the offense an average start at its own 32.7 over 36 possessions. Game averages range from its own 26.5 to 40.2. In the narrower 23-possession sample without an identified return or penalty effect, the average is its own 30.1. The stops provide opportunities, but generally still leave a long drive to complete. The offense has produced an estimated 3.90 points before extra points per scoring opportunity. That payoff must be read alongside how often it can build the next drive.
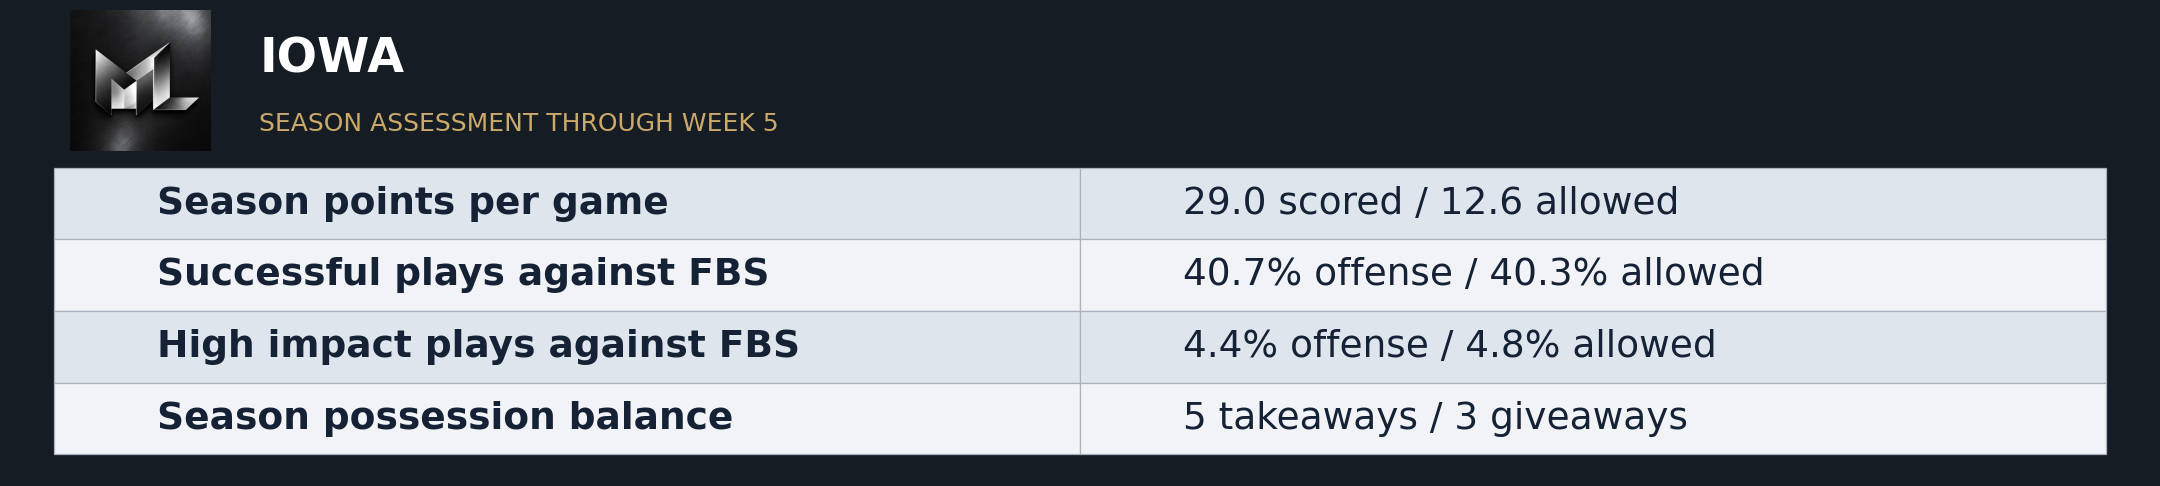
| Season points per game | 29.0 scored / 12.6 allowed |
| Successful plays against FBS | 40.7% offense / 40.3% allowed |
| High impact plays against FBS | 4.4% offense / 4.8% allowed |
| Season possession balance | 5 takeaways / 3 giveaways |
Our coverage of these teams
A matching published game video is not available in the verified archive yet.