Winning does not fix everything
The complete covered Week 5 slate, college performance rankings and season assessments from our October 4 recap.
The Matchup Lab · 2026-10-04

Jump to a team or section
ESPN’s completed-game scoreboards confirm the October 3 results covered below. The Matchup Lab’s original five-factor assessments retain their Week 5 cutoff.
College Football Week 5 Recap
The Matchup Lab | Games of October 3 2026 | Season assessment through Week 5
Winning does not fix everything
A win can settle the result and leave the argument open. Alabama supplied the most complete statement on the preview slate. Missouri exposed a Florida defense that had already offered warning signs. Texas Tech, USC and BYU won games that still demanded uncomfortable questions about how reliably their offenses can move the ball.
The season is the subject. Saturday is the newest evidence. This recap follows the actual Friday preview across its 16 matchups and 19 ranked teams. All 16 games are final; none is pending or postponed. Texas, Ole Miss, Utah, Oregon, Oklahoma State and UCLA were on the preview's bye list and receive no invented game recap.
The scoreboard on the following pages grades the exact prices recorded in that preview. Our separate performance index then evaluates the full FBS field, including teams outside this article's game coverage. A place in the AP Top 25 determined the preview slate; it does not determine a place in our rankings.
The complete preview scoreboard
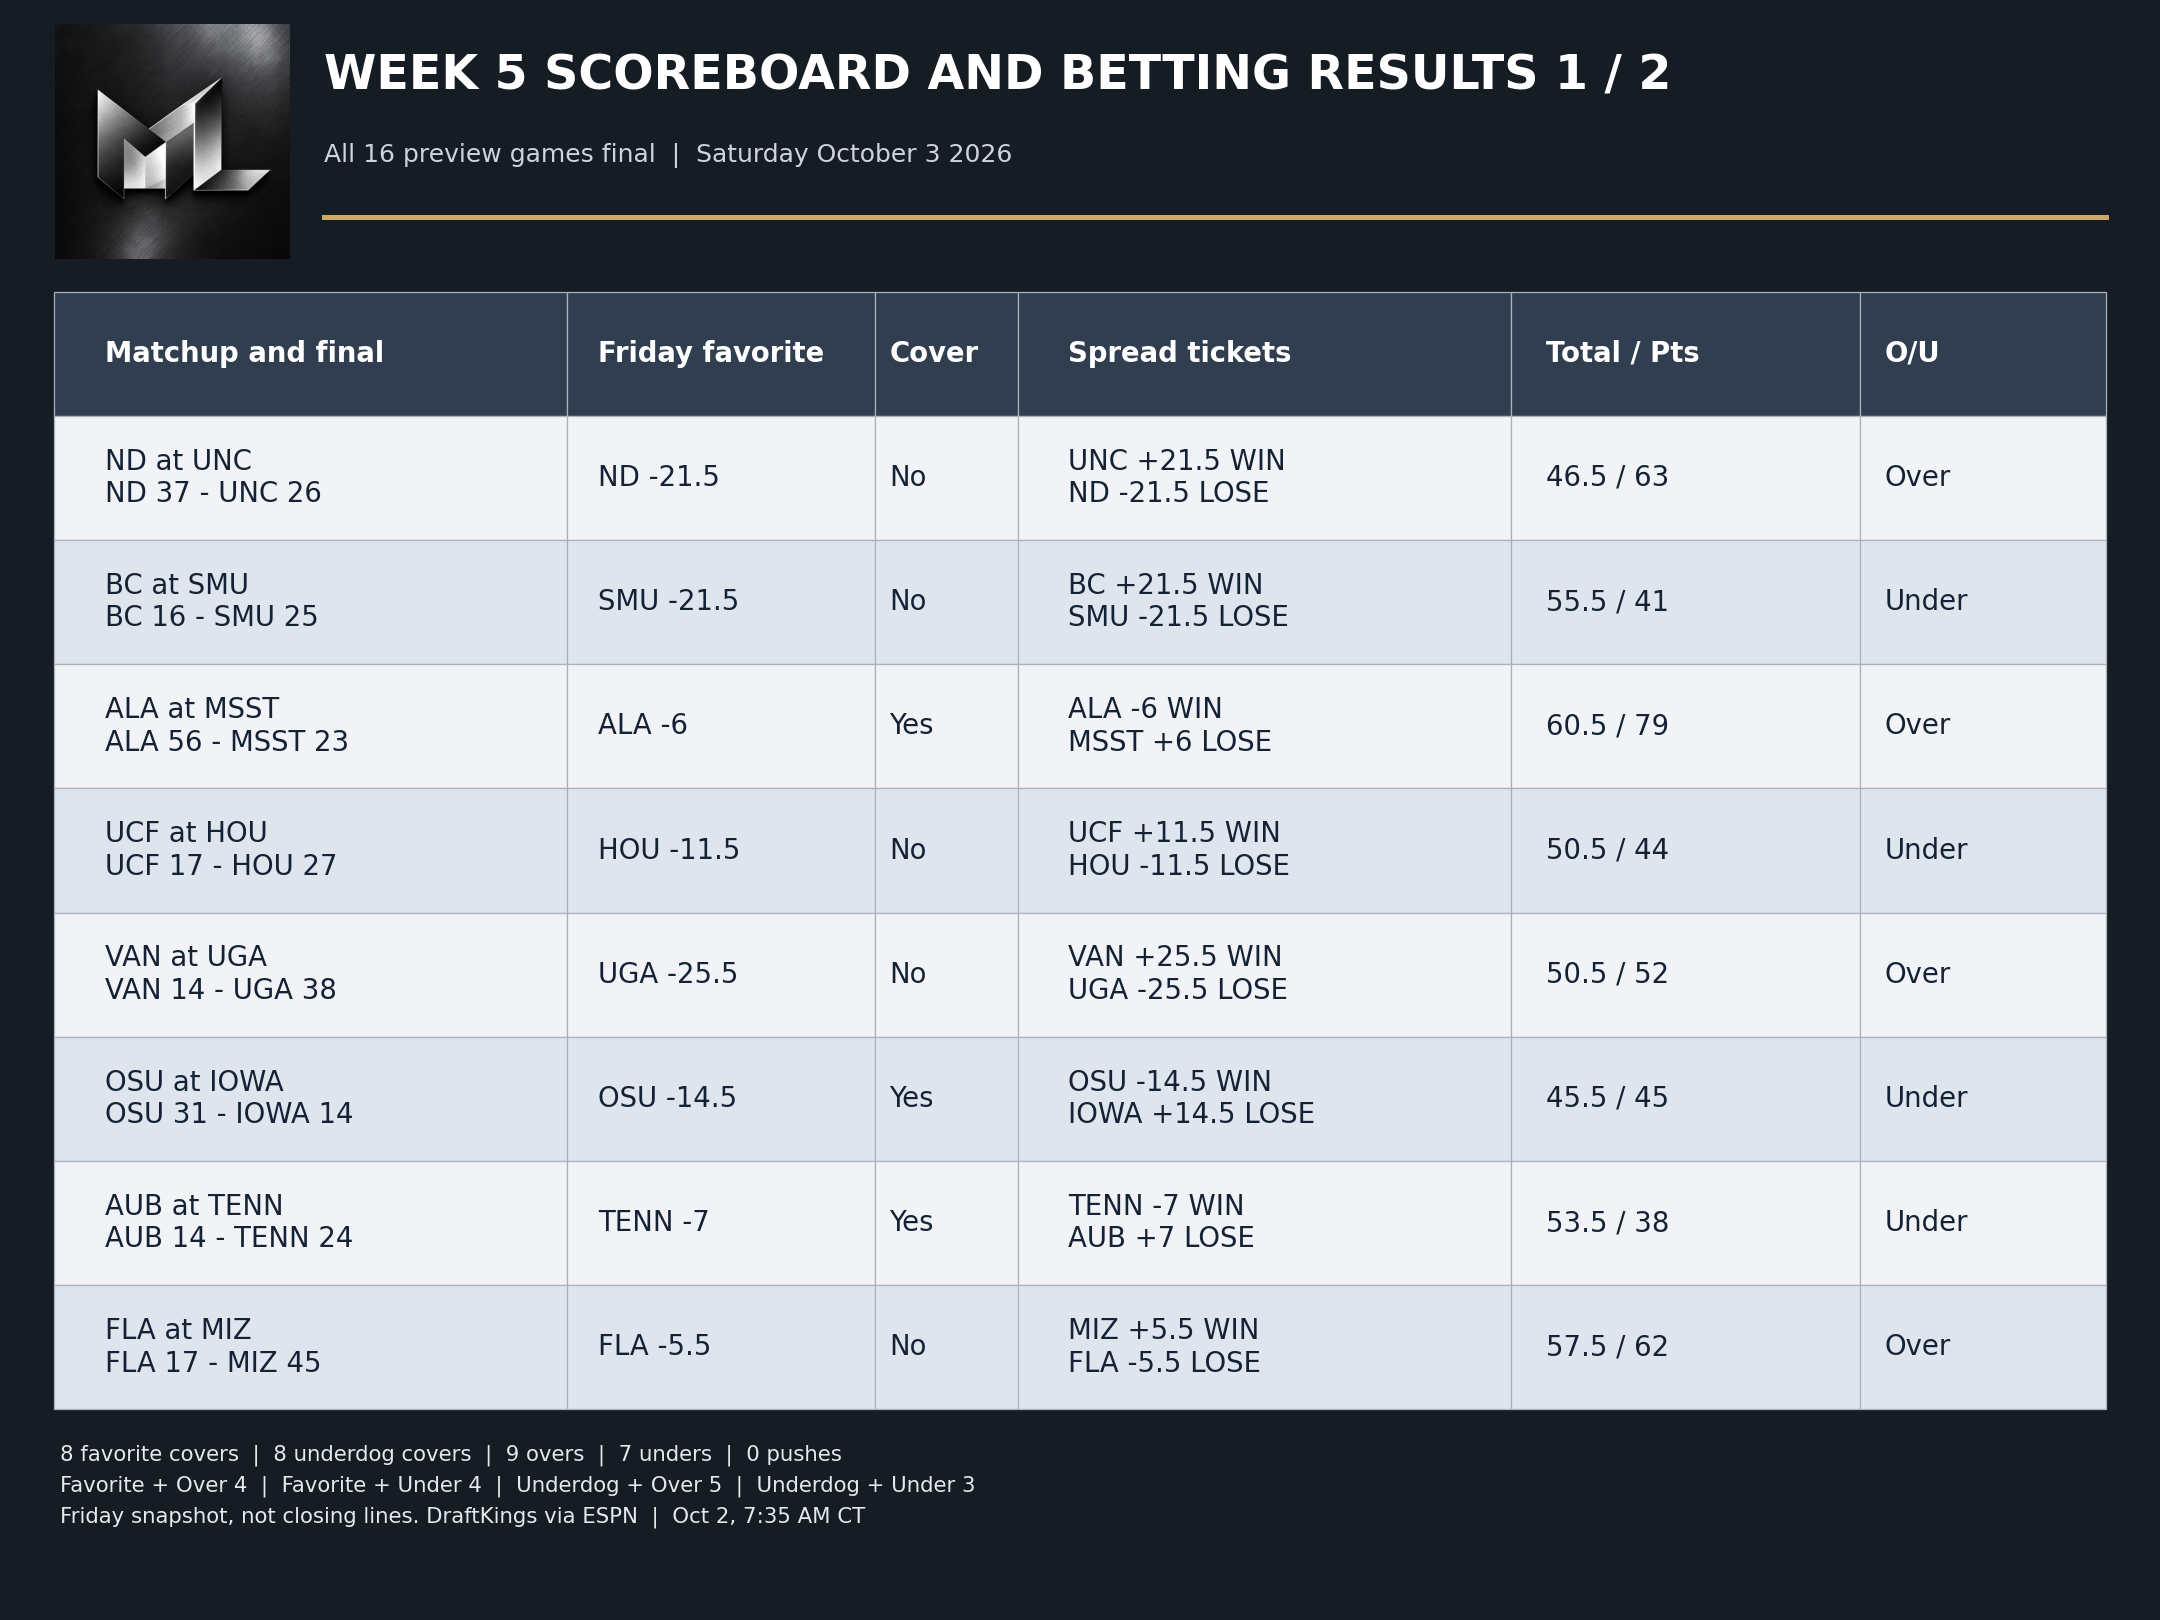
The first eight matchups include the week's sharpest contrast. Alabama covered by 27 points, while Florida lost outright despite being favored by 5.5. Notre Dame and Georgia won but did not cover. Winning the game and cashing the ticket remain different assignments.
Each row shows the favorite and spread recorded Friday, whether it covered, both spread tickets, the recorded total and the actual combined score. The final score lists the visiting team first. Overtime is included in the final and total.
The complete preview scoreboard continued
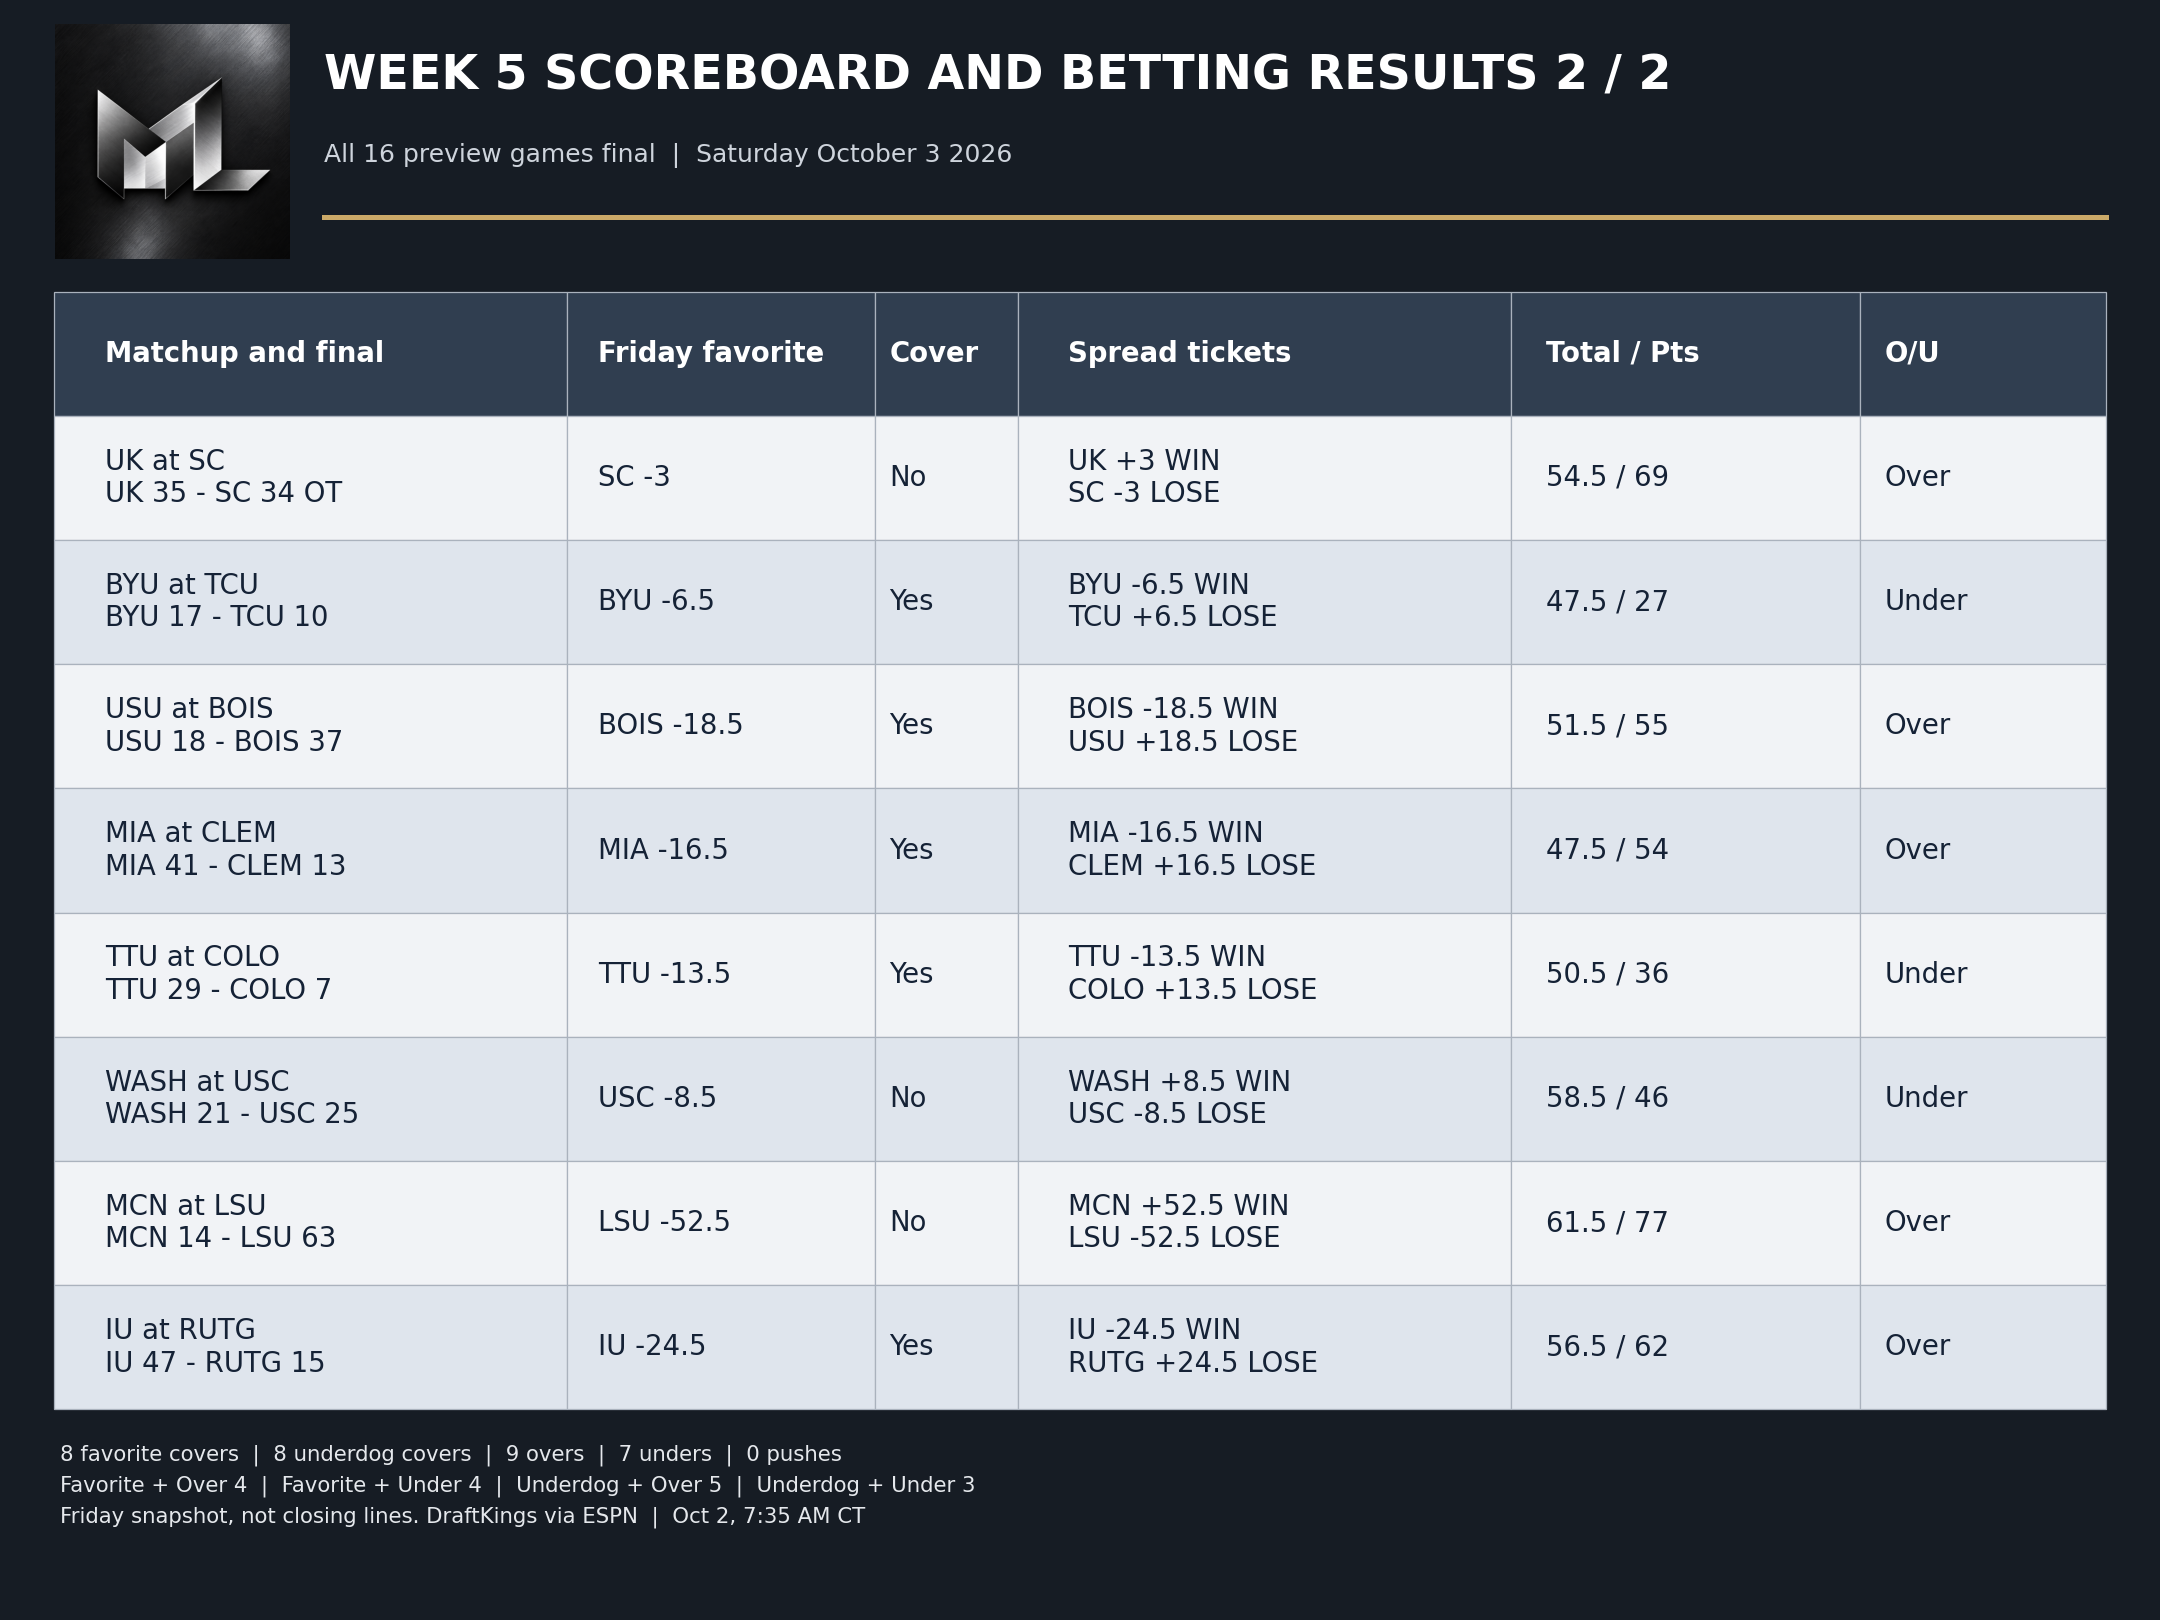
Across all 16 games, favorites and underdogs split the spread results 8-8. Nine games went over and seven went under. There were no spread or total pushes and no missing Friday prices. The four combinations were favorite and over 4, favorite and under 4, underdog and over 5, and underdog and under 3.
BYU won by seven against a recorded 6.5-point spread. Boise State won by 19 against 18.5. Each favorite covered by half a point. Ohio State and Iowa combined for 45 against 45.5, a half-point under. These are comparisons with Friday's October 2 snapshot, not claims about the closing market or returns at unspecified odds.
Our updated college performance rankings
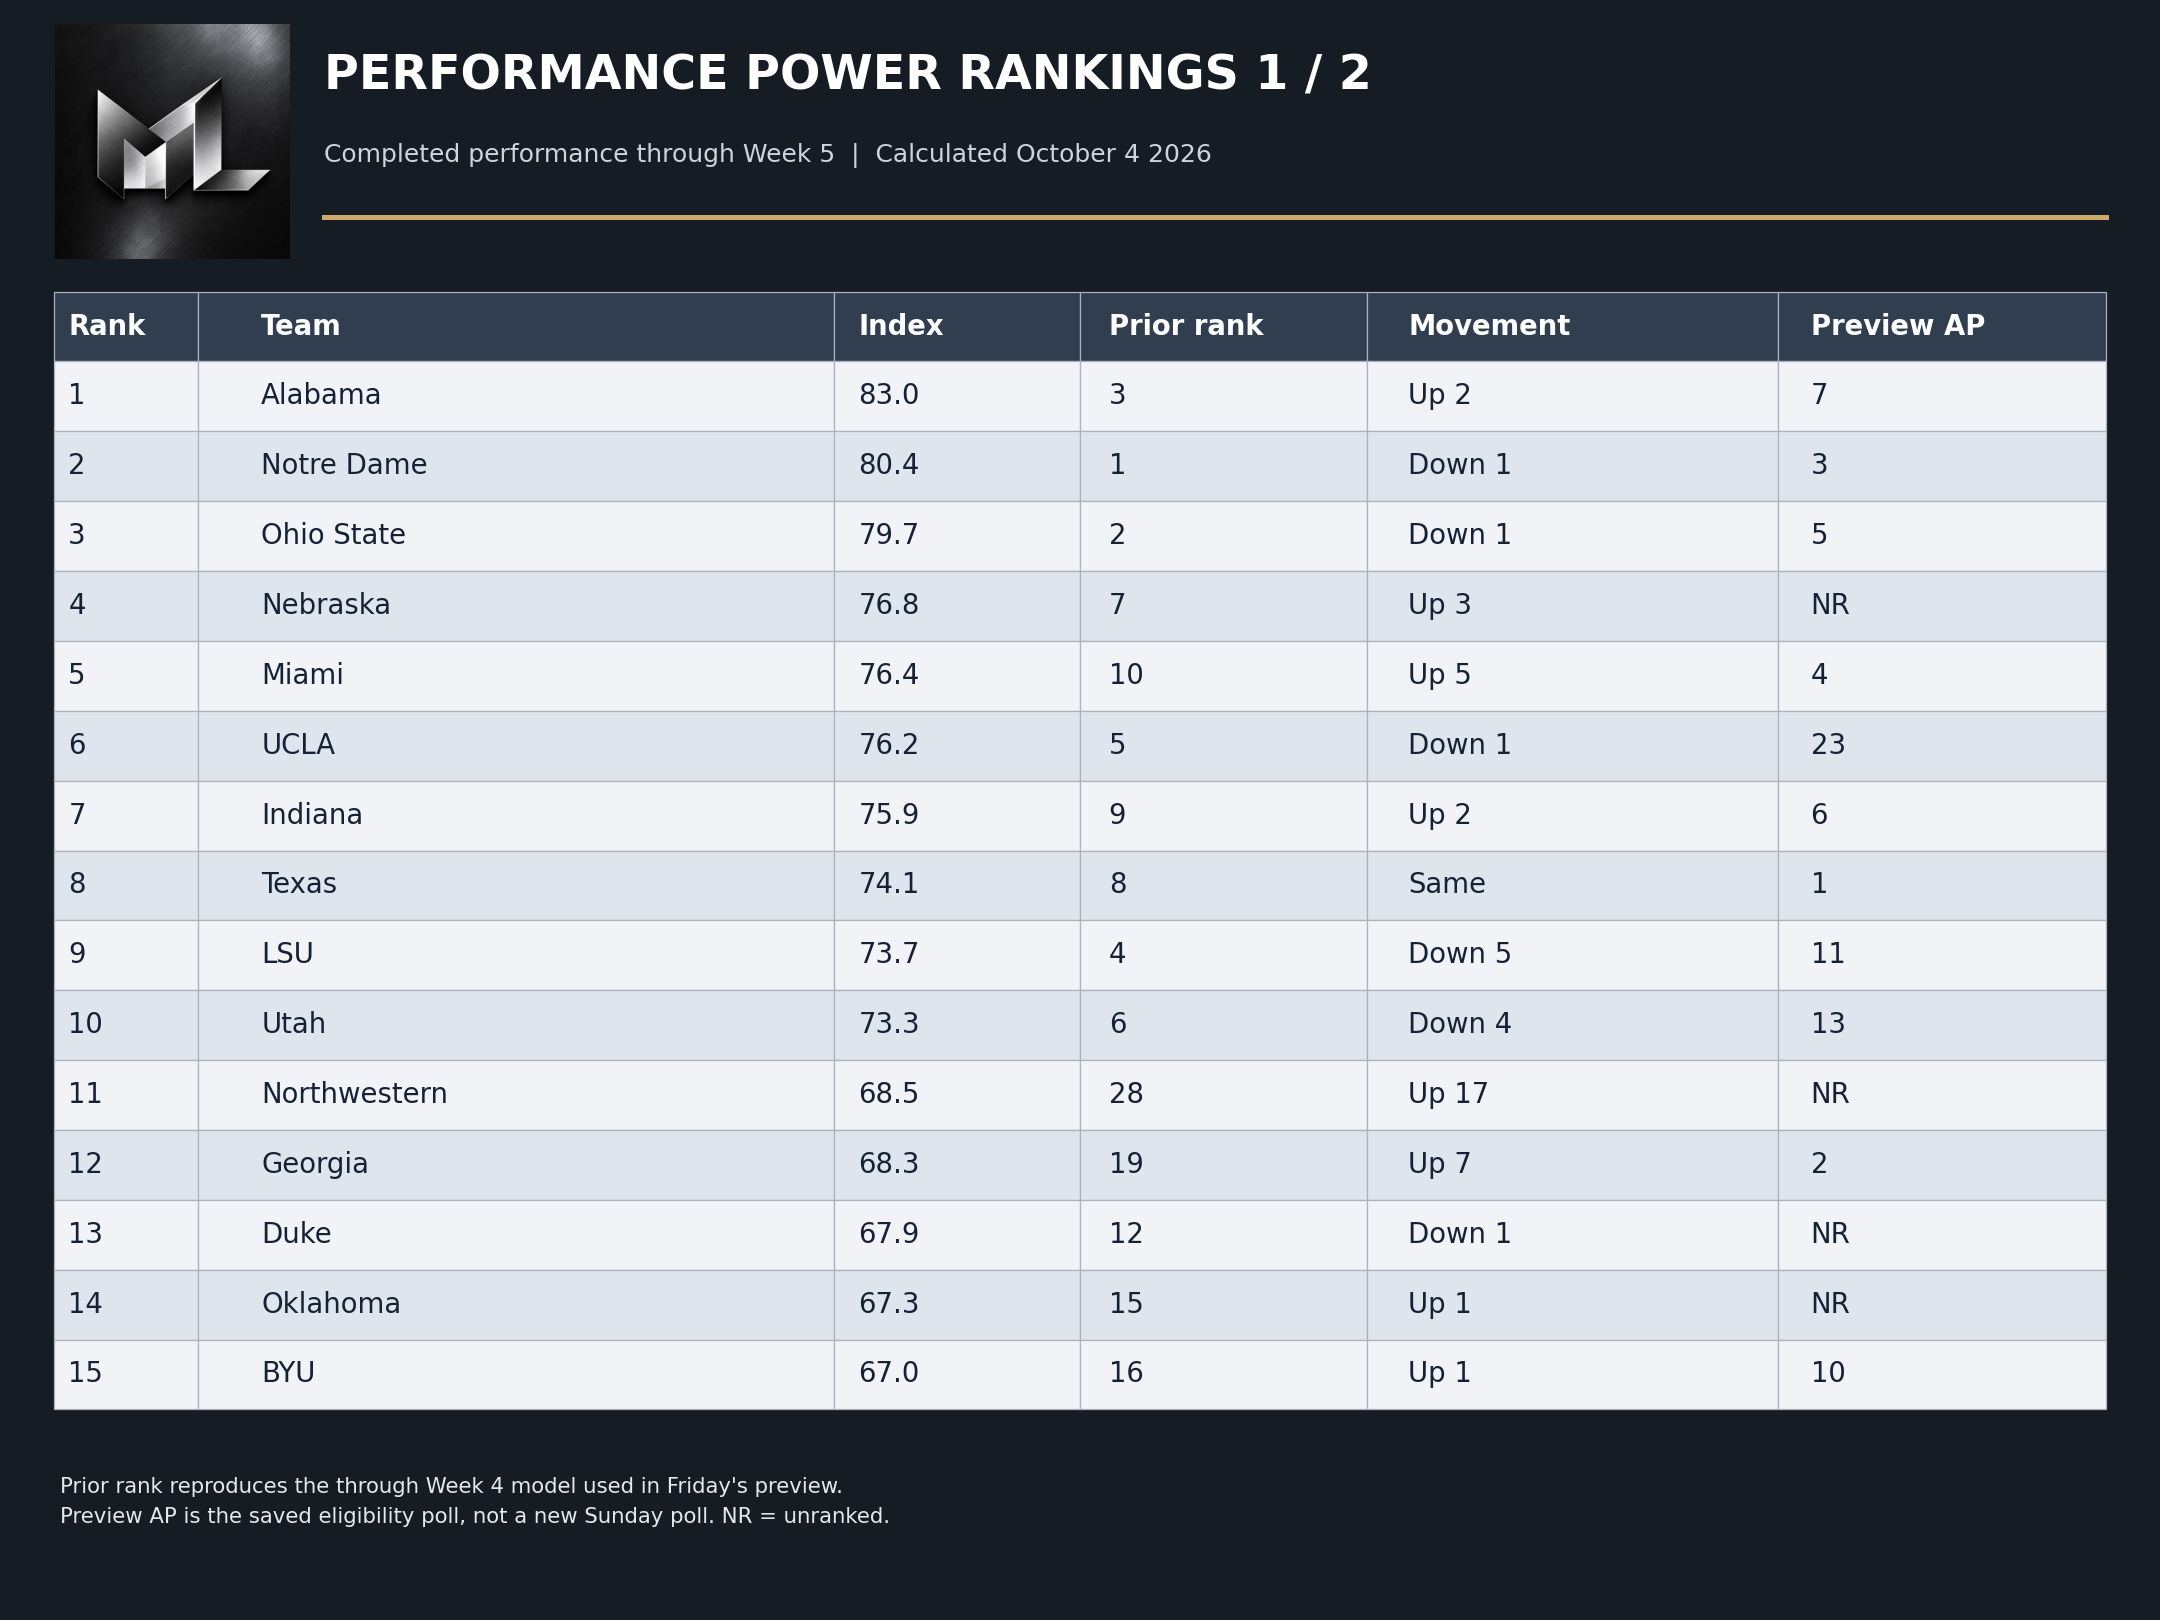
Alabama rises from third to first after combining strong offensive production with defensive pressure and four takeaways at Mississippi State. Notre Dame and Ohio State follow in second and third. Miami climbs from tenth to fifth, while Georgia moves from nineteenth to twelfth. These are measures of completed performance, not predictions of the next winner.
Our updated college performance rankings continued
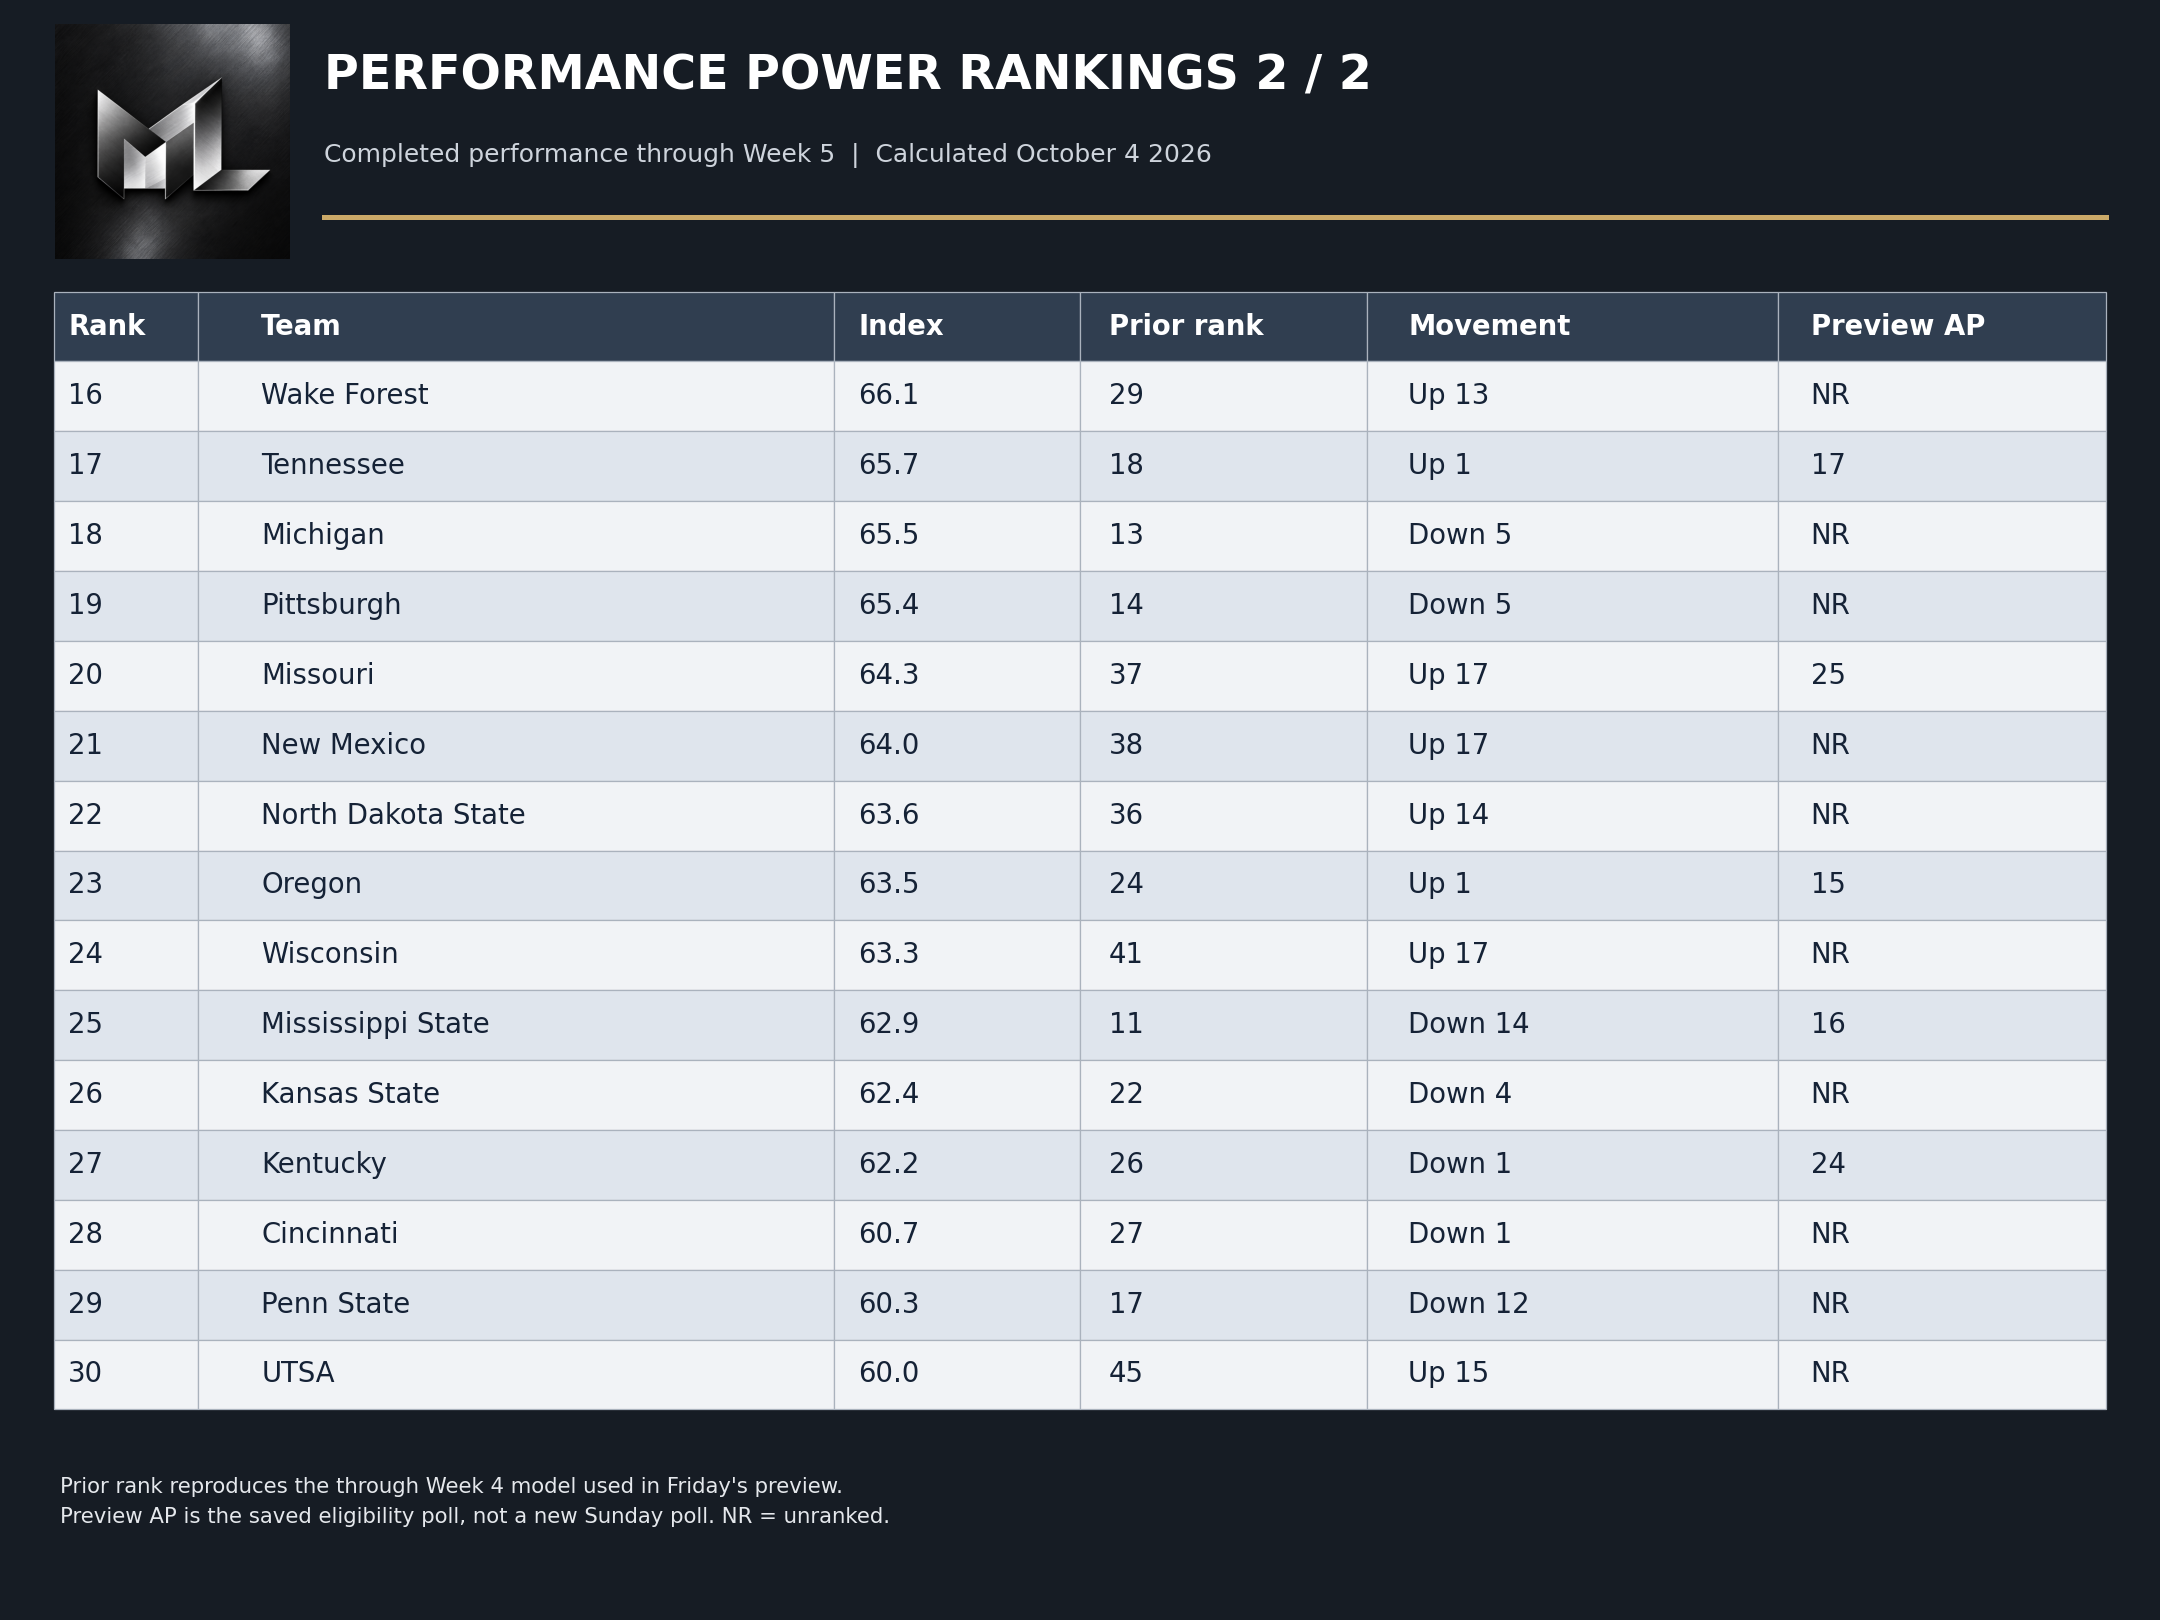
Missouri rises from 37th to 20th; Mississippi State falls from 11th to 25th. Florida falls from 21st to 43rd and Texas Tech from 31st to 56th, outside the displayed top 30. A comfortable final does not require a strong underlying offensive game. The index also changes when opponents' results change, including for teams on a bye.
Movement compares the reproduced through Week 4 calculation with the through Week 5 calculation. All 30 ranks and one-decimal scores shown in Friday's graphic reconcile with that prior calculation. The Preview AP column carries Friday's poll snapshot forward solely for context; this document does not assume a new Sunday AP poll has been released.
How our college index is calculated
The model asks how a team has performed and how demanding its opponents have been. It ranks all 138 FBS teams. It uses no AP votes, betting lines, recruiting reputation or future-game prediction to assign a score.
Thirty percent of the final composite comes from five areas of performance. Within that portion, efficiency receives 40 percent, high-impact plays 25 percent, finishing scoring chances 15 percent, starting field position 10 percent and turnovers 10 percent. Efficiency itself is 60 percent successful-play margin and 40 percent expected-points-per-play margin. A successful play adds expected points, meaning it improves the scoring value of the situation.
High-impact plays use the saved model thresholds, at least 2.4 expected points added on a pass or 1.8 on a run. This is not a fixed 20-yard definition. The model compares the offense's rate with the rate allowed. Field position compares the distances each offense normally must travel. Turnovers are takeaways minus giveaways, divided by games plus two to reduce the influence of a small sample.
Finishing estimates the points earned on charted drives ending at or beyond the opponent's 40 or ending in a score. Touchdowns count six and field goals three, with extra points excluded. The saved implementation uses the starting position plus nonnegative net drive yards to identify these opportunities. It does not count every temporary crossing of the 40. Eight average opportunities are added to each side before taking the offensive-minus-defensive difference, so a handful of trips cannot dominate.
The other 70 percent comes from a network that fits each team's expected-points-per-play margin against its opponents. Those opponents are evaluated against their own opponents at the same time. Each game margin is capped at plus or minus 0.45, and each FBS team receives the equivalent of two neutral-opponent games. FCS opposition is anchored at its observed average margin against FBS teams. This is why schedule context matters without simply borrowing a poll.
Each category and the opponent-network estimate are centered on the FBS average and divided by their population standard deviation. Those standardized values are capped at plus or minus 2.5. The composite is 30 percent of the weighted category score plus 70 percent of the opponent-network score. The published index is 50 plus 15 times that composite. Higher is better; 50 is the reference center, not a winning percentage. The saved formula has no final hard 0-to-100 clamp.
The statistical sample matters. Successful-play, high-impact-play and summary field-position inputs use the charted FBS-opponent sample. The turnover, drive-finishing and opponent-network inputs follow the saved broader game-level inputs, including FCS games. Traditional averages in the team assessments include every completed game. The separate research package preserves the exact inputs, calculation code and coverage checks.
Reading the season assessments
The team sections integrate offense, defense, possession and territory. Weekly successful-play ranges use charted FBS opposition and need multiple observations. USC's two opening-week games are pooled in that weekly view. An absent observation is not evidence of consistency. Traditional scoring and yardage averages include FCS opponents; the charted rate sample is explicitly narrower.
The field-position check follows regulation offensive possessions immediately after an opponent punt, turnover on downs or missed field goal. It excludes turnover possessions, halftime and quarter-boundary transitions, overtime starts and drives containing only kneeldowns. The narrower comparison also removes transitions with an identified return, penalty, blocked kick or muff. This comparison is a different subset, not a mathematical estimate of the yards caused by returns.
Even the narrower figure still includes the opponent's punting or kicking. It shows how much field the offense receives after a stop, rather than claiming the defense alone caused that location. A defensive touchdown is reported as a score, not an offensive starting-position benefit. Team takeaway and giveaway totals can include special-teams events, which are not automatically credited to the defense.
The finishing figures in the team assessments are unshrunk descriptive estimates from the charted regulation drives, with six points per touchdown and three per field goal. The ranking calculation uses its saved definition and neutral-sample adjustment separately. A strong finishing average does not mean a team creates enough opportunities, and a short field does not mean its offense earned that territory.
The practical question in every section is the same. What can this team keep doing, what has changed from game to game, and which part of the latest result depended on help it cannot assume will arrive next Saturday?
Notre Dame
5-0 overall | Preview AP No. 3 | Matchup Lab No. 2 | Index 80.4
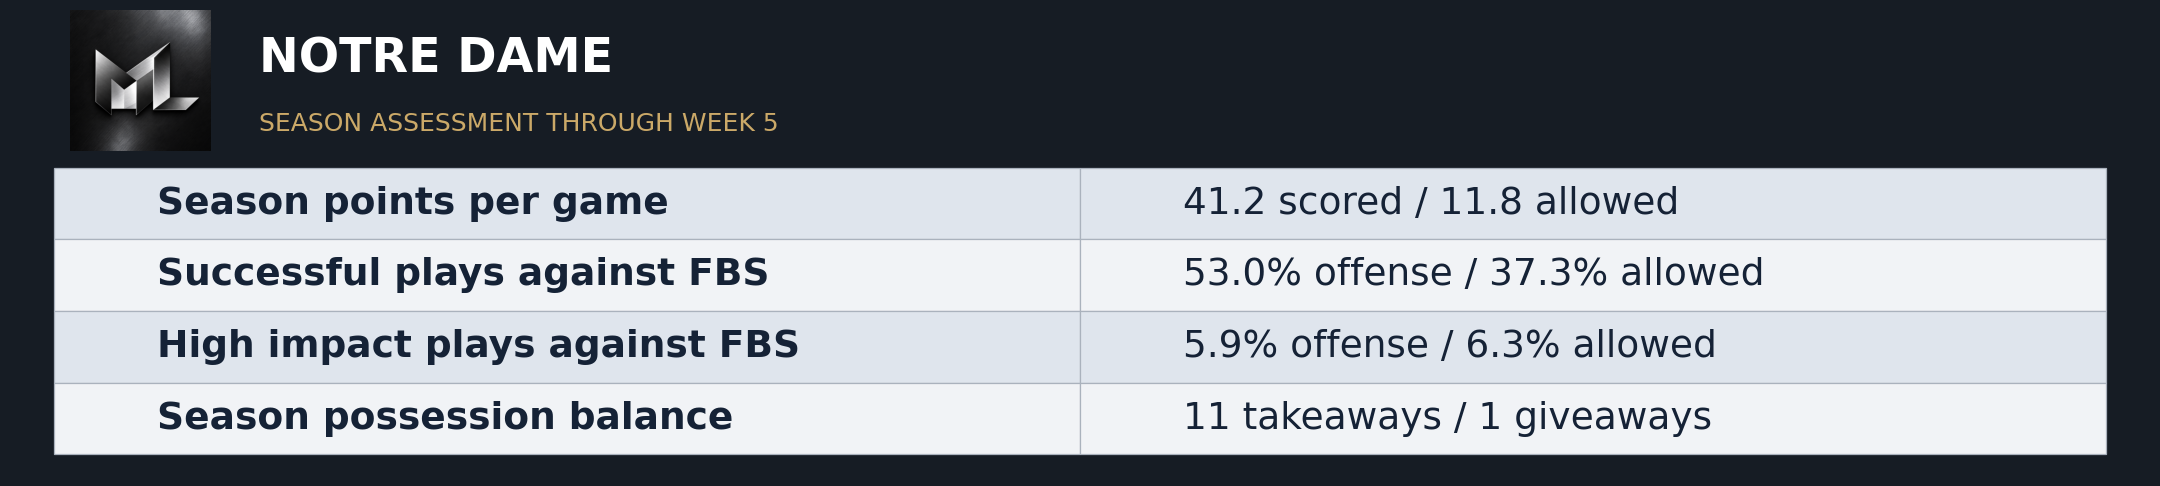
Notre Dame remains one of the season's more dependable offenses, even after a win that made its pass defense look less comfortable. Its successful-play rate has stayed between 47.5 and 56.8 percent across five games. That is a much narrower range than the defensive results, and the Irish have surrendered only one possession by turnover all season. Their 41.2 points per game are supported by ordinary gains and ball security, not simply a collection of long touchdowns.
The 37-26 win at North Carolina supplied the strongest rushing evidence yet. Notre Dame gained 241 yards on the ground, finished with 475 overall and converted three fourth downs. Marcus Freeman praised the team's ability to run when the opponent expected it. The production supports that assessment. Four conversions on 11 third downs, however, explain why those fourth-down decisions mattered. The offense earned its yardage, but not every series stayed comfortable.
The defense allowed 285 yards and took the ball away twice, but the 26 points on North Carolina's scoreboard need separating. Jaden Jefferson's 98-yard kickoff-return touchdown came against the coverage unit. The remaining 20 points still exceeded any previous opponent's full-game total. Notre Dame's season case remains strong, but its defensive finishing and kickoff coverage deserve separate reviews. A 5-0 record does not excuse either unit from its own assignment.
Across the season, qualifying stops have handed the offense an average start at its own 26.9 over 27 possessions. Game averages range from its own 13.2 to 37.5. In the narrower 18-possession sample without an identified return or penalty effect, the average is its own 21.3. Those stops usually leave substantial field to cover, even before judging the offense. The offense has produced an estimated 4.63 points before extra points per scoring opportunity. That payoff must be read alongside how often it can build the next drive.
| Season points per game | 41.2 scored / 11.8 allowed |
| Successful plays against FBS | 53.0% offense / 37.3% allowed |
| High impact plays against FBS | 5.9% offense / 6.3% allowed |
| Season possession balance | 11 takeaways / 1 giveaways |
SMU
4-1 overall | Preview AP No. 21 | Matchup Lab No. 69 | Index 50.1
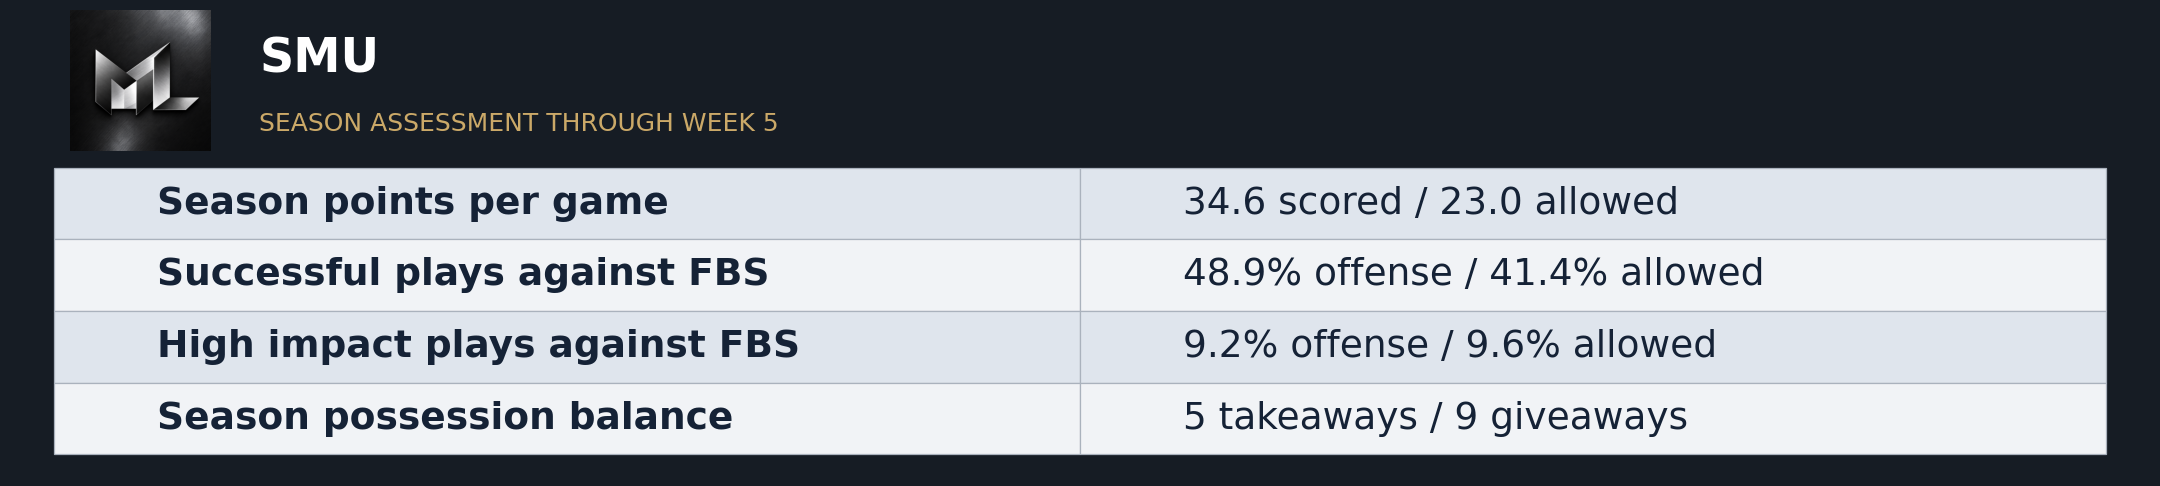
SMU's season continues to separate movement from payoff. The Mustangs average 484.2 yards but 34.6 points, and nine giveaways against five takeaways have repeatedly made productive stretches less valuable. Their charted offensive successful-play rate has ranged from 36.7 to 57.1 percent. This is a capable offense with substantial weekly variation, not a reliable machine that merely had one untidy afternoon.
The 25-16 win over Boston College reversed the familiar problem. SMU protected the ball and converted seven of 14 third downs, but produced only 218 yards, including 58 rushing. Boston College gained 322. Friday's preview questioned whether the Mustangs could preserve possessions and improve their return from scoring territory. They preserved them. The disappearance of much of their yardage creates a separate question.
The defense kept Boston College to 16 and supplied the only takeaway, but allowing seven third-down conversions on 16 attempts left more work than the final margin suggests. SMU's opponents still generate a slightly greater share of high-impact plays than its own offense in the charted FBS sample. This win is evidence that the Mustangs can survive without a passing avalanche. It is not evidence that their offense has become consistent.
Across the season, qualifying stops have handed the offense an average start at its own 32.3 over 32 possessions. Game averages range from its own 27.7 to 39.0. In the narrower 20-possession sample without an identified return or penalty effect, the average is its own 29.9. The stops provide opportunities, but generally still leave a long drive to complete. The offense has produced an estimated 3.73 points before extra points per scoring opportunity. That payoff must be read alongside how often it can build the next drive.
| Season points per game | 34.6 scored / 23.0 allowed |
| Successful plays against FBS | 48.9% offense / 41.4% allowed |
| High impact plays against FBS | 9.2% offense / 9.6% allowed |
| Season possession balance | 5 takeaways / 9 giveaways |
Alabama
5-0 overall | Preview AP No. 7 | Matchup Lab No. 1 | Index 83.0
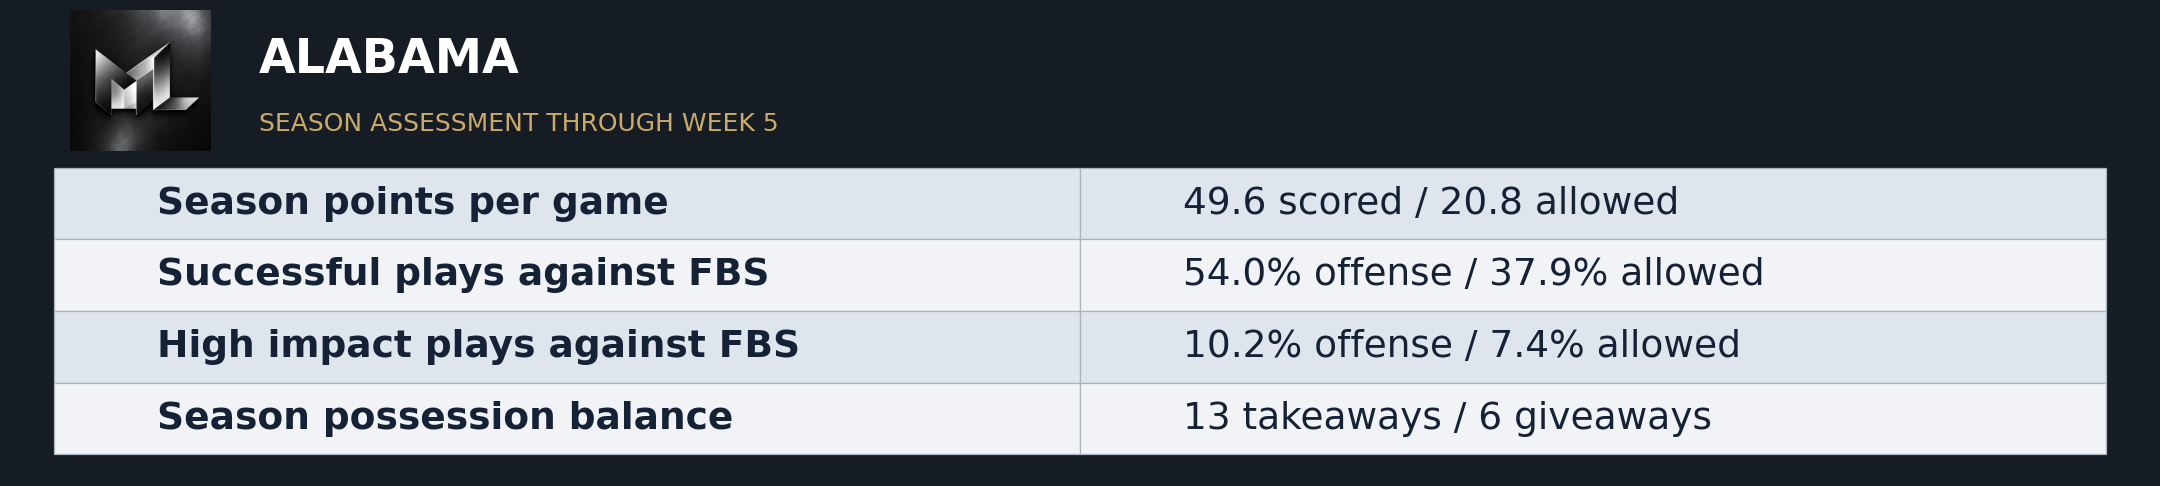
Alabama now leads our performance index because productive offense has been accompanied by a stronger defensive floor than most contenders can show. Through five games it averages 49.6 points, allows 78.6 rushing yards and holds a successful-play advantage of roughly 16 percentage points against FBS opponents. Its offensive weekly rate has never fallen below 49 percent. The level varies, but the offense has repeatedly supplied something usable.
The 56-23 win at Mississippi State made that combination explicit. Alabama converted six of nine third downs, gained 483 yards and held the Bulldogs to 18 rushing yards. Keelon Russell said, 'You make your mistakes and you learn from it.' The passing performance supports progress, but Alabama still lost two fumbles and committed 10 penalties. A comfortable lead is not an exemption from those details.
Four Mississippi State giveaways helped create the separation, including a defensive touchdown. Alabama's net turnover sequence is even, even, plus three, plus two and plus two. The extra possessions have become a recent pattern, but they were not a prerequisite for the offense's earlier production. Friday's preview expected the defensive difference to matter even with comparable offensive profiles. It did. The next standard is to retain that advantage while giving the opponent fewer unnecessary chances.
Across the season, qualifying stops have handed the offense an average start at its own 32.7 over 29 possessions. Game averages range from its own 23.2 to 40.4. In the narrower 23-possession sample without an identified return or penalty effect, the average is its own 30.7. The stops provide opportunities, but generally still leave a long drive to complete. The offense has produced an estimated 5.05 points before extra points per scoring opportunity. That payoff must be read alongside how often it can build the next drive.
| Season points per game | 49.6 scored / 20.8 allowed |
| Successful plays against FBS | 54.0% offense / 37.9% allowed |
| High impact plays against FBS | 10.2% offense / 7.4% allowed |
| Season possession balance | 13 takeaways / 6 giveaways |
Mississippi State
4-1 overall | Preview AP No. 16 | Matchup Lab No. 25 | Index 62.9
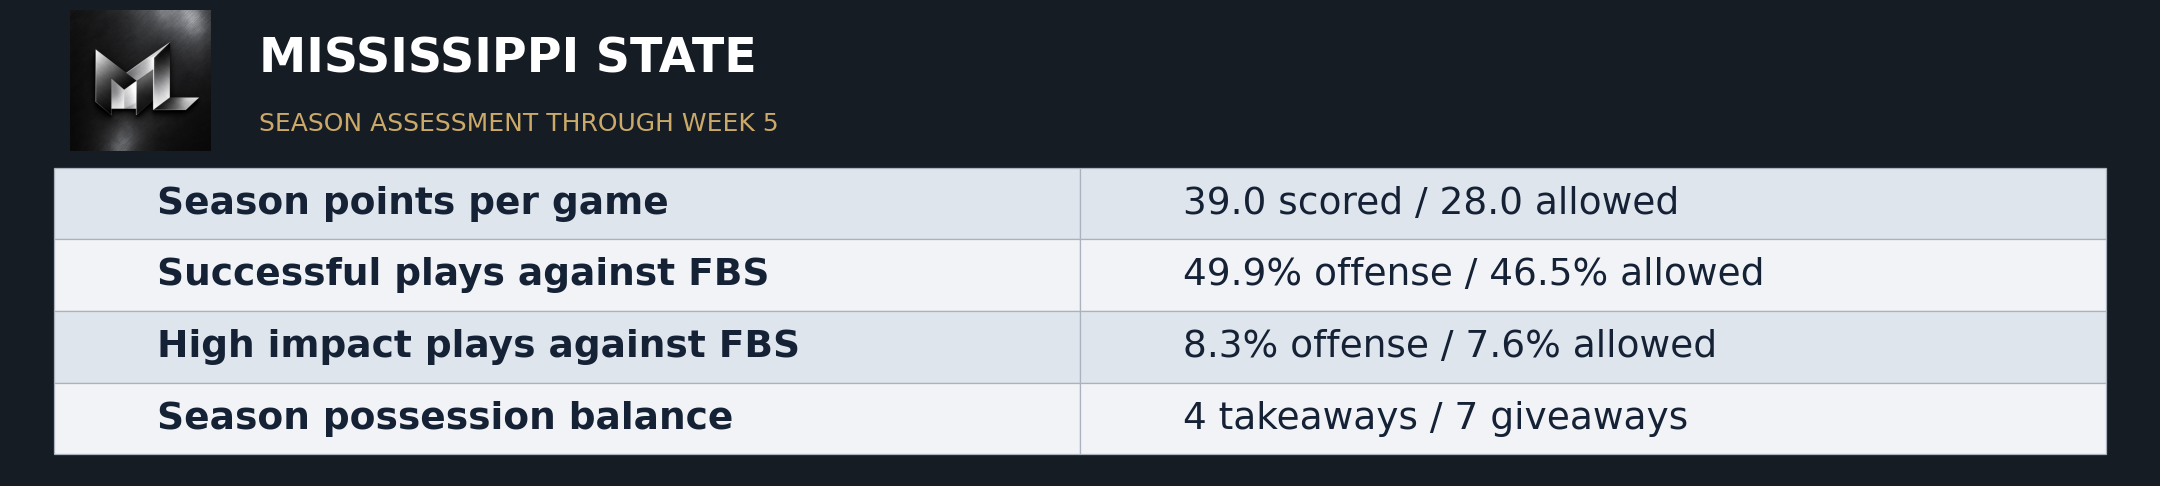
Mississippi State's offense built a credible unbeaten record, but its recent direction now demands more attention than the first four wins. Its charted successful-play rate has stepped down from roughly 55 to 56 percent in the opening games to 50.9, 48.7 and 38.6 percent. At the same time, opponents have become increasingly successful. The 56-23 loss to Alabama intensified a trend instead of creating an entirely new concern.
Eighteen rushing yards and four giveaways left the Bulldogs trying to recover through the air. They gained 302 yards, while Alabama gained 483 and converted two-thirds of its third downs. Jeff Lebby said Kamario Taylor was not able to do much with his legs. That explains a tactical limitation observed in this game; it does not establish a future injury prognosis or make the lost possessions harmless.
The season averages still show 487 yards and 39 points, but those totals now coexist with 28 points allowed per game and a negative turnover balance. Friday's case for Mississippi State rested on sustained offense without requiring takeaways. That argument was not supported Saturday. The Bulldogs need to recover useful early plays and stop opponents before scoring territory, because their recent field-position support has also been moving in the wrong direction.
Across the season, qualifying stops have handed the offense an average start at its own 25.5 over 27 possessions. Game averages range from its own 12.5 to 39.0. In the narrower 24-possession sample without an identified return or penalty effect, the average is its own 23.6. Those stops usually leave substantial field to cover, even before judging the offense. The offense has produced an estimated 4.75 points before extra points per scoring opportunity. That payoff must be read alongside how often it can build the next drive.
| Season points per game | 39.0 scored / 28.0 allowed |
| Successful plays against FBS | 49.9% offense / 46.5% allowed |
| High impact plays against FBS | 8.3% offense / 7.6% allowed |
| Season possession balance | 4 takeaways / 7 giveaways |
Houston
4-1 overall | Preview AP No. 20 | Matchup Lab No. 36 | Index 58.6
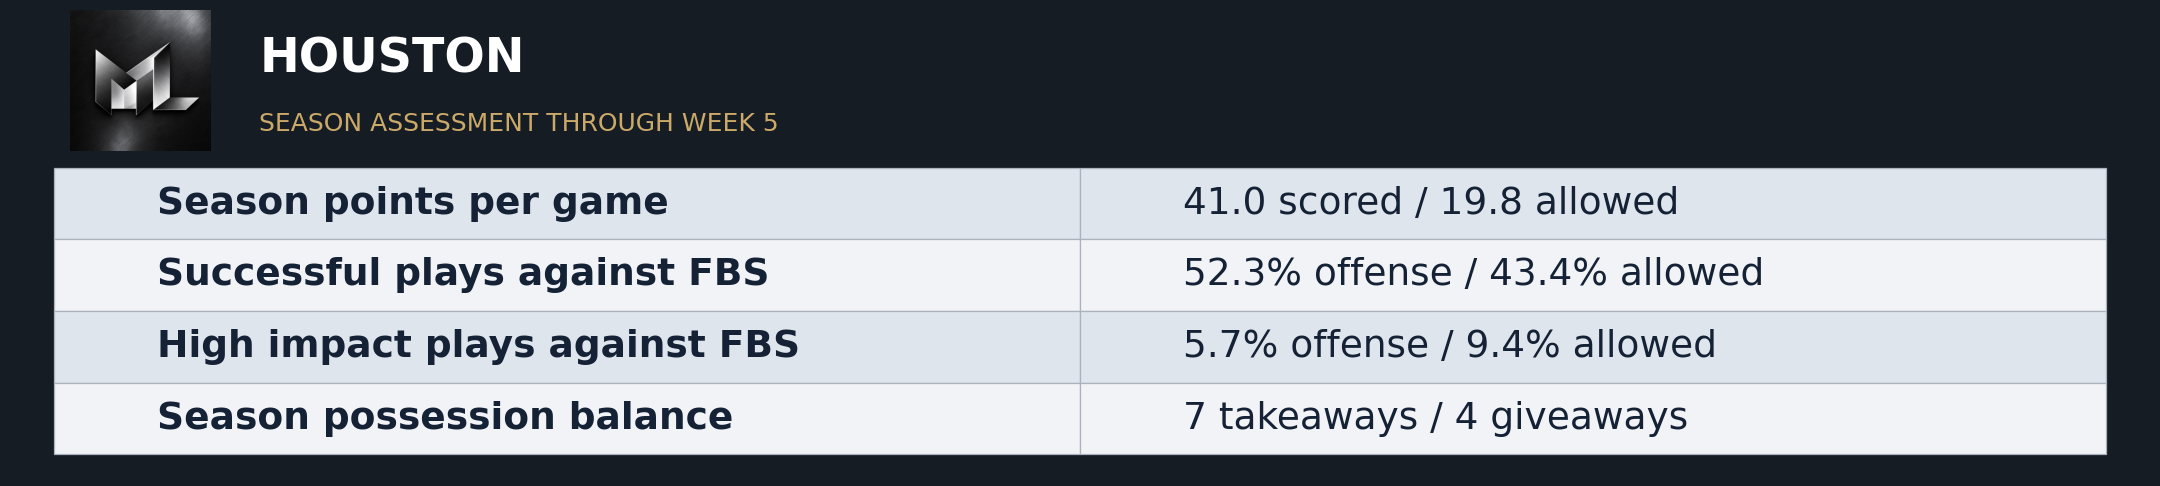
Houston's most dependable season feature is its run defense, which has allowed 65.4 yards per game. That can force opponents to throw and help the Cougars recover useful possessions, but the offense has not sustained its most spectacular early conversion rates. Houston's FBS successful-play rate has varied from 46.1 to 62.3 percent. The 77-point Southern game also remains part of the traditional scoring average, so 41 points per game should not be treated as a normal conference Saturday.
Against UCF, Houston gained 393 yards and won 27-17, with both teams losing the ball once. The Cougars converted eight of 16 third downs and limited UCF to four of 14. That was a practical route to controlling the game without a net turnover advantage. The rushing offense's 154 yards were well below its earlier season pace, but the defense held UCF to 73.
The concern remains the size of the plays allowed through the air. Opponents' high-impact-play rate exceeds Houston's offensive rate, even though Houston wins more ordinary snaps overall. Friday's preview identified that opening for UCF; 259 passing yards showed it did not vanish. Houston improved its standing by ending enough drives, but a team with this territorial support should keep demanding more from its best scoring chances.
Across the season, qualifying stops have handed the offense an average start at its own 38.0 over 28 possessions. Game averages range from its own 22.8 to 49.4. In the narrower 20-possession sample without an identified return or penalty effect, the average is its own 38.0. That is useful territorial support, although the opponent's kicking remains part of it. The offense has produced an estimated 4.19 points before extra points per scoring opportunity. That payoff must be read alongside how often it can build the next drive.
| Season points per game | 41.0 scored / 19.8 allowed |
| Successful plays against FBS | 52.3% offense / 43.4% allowed |
| High impact plays against FBS | 5.7% offense / 9.4% allowed |
| Season possession balance | 7 takeaways / 4 giveaways |
Georgia
5-0 overall | Preview AP No. 2 | Matchup Lab No. 12 | Index 68.3
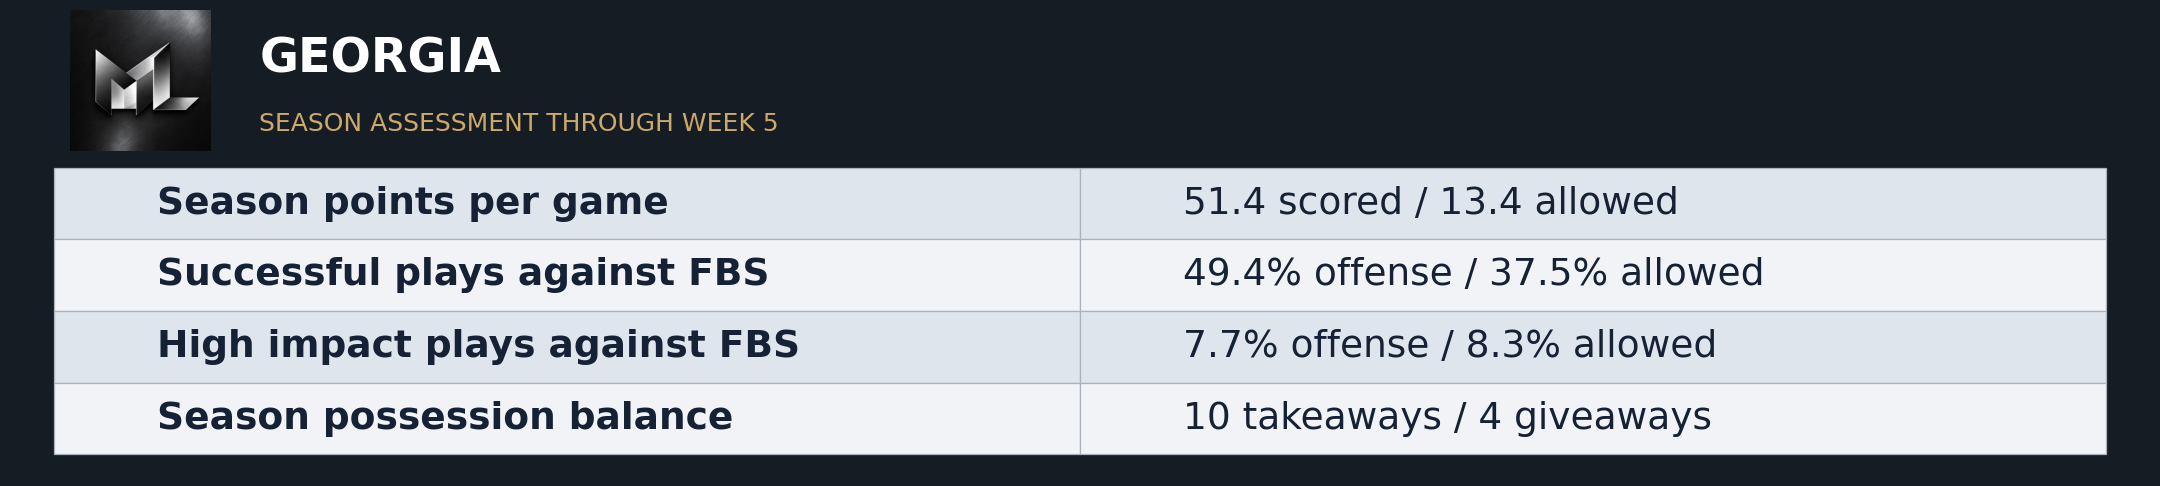
Georgia has paired overwhelming scoring margins with a less uniform offense underneath them. Its charted offensive successful-play rate has ranged from 32.7 to 59.7 percent, while its defense has been steadier. The Bulldogs allow 57.4 rushing yards and 13.4 points per game. Six more takeaways than giveaways and strong starting position have helped the offense score 51.4 per game without requiring the same level of execution every week.
The 38-14 Vanderbilt win supplied better evidence of sustained offense than the previous Oklahoma game. Georgia gained 471 yards, converted seven of 10 third downs and committed no turnovers. Vanderbilt scored nothing after halftime. That combination answers Friday's question about whether Georgia could keep moving when the game required ordinary possessions rather than a quick avalanche.
It does not eliminate every concern. Vanderbilt averaged 8.3 yards per pass attempt, and Georgia's season high-impact-play allowance remains slightly above its own offensive rate in the FBS sample. Limiting the run and winning possession are substantial strengths; preventing the occasional damaging pass is still relevant. The latest performance improved the season case precisely because Georgia supplied more repeatable work, rather than merely adding another large number to the win column.
Across the season, qualifying stops have handed the offense an average start at its own 32.5 over 39 possessions. Game averages range from its own 21.7 to 42.0. In the narrower 26-possession sample without an identified return or penalty effect, the average is its own 29.8. The stops provide opportunities, but generally still leave a long drive to complete. The offense has produced an estimated 4.86 points before extra points per scoring opportunity. That payoff must be read alongside how often it can build the next drive.
| Season points per game | 51.4 scored / 13.4 allowed |
| Successful plays against FBS | 49.4% offense / 37.5% allowed |
| High impact plays against FBS | 7.7% offense / 8.3% allowed |
| Season possession balance | 10 takeaways / 4 giveaways |
Ohio State
4-1 overall | Preview AP No. 5 | Matchup Lab No. 3 | Index 79.7
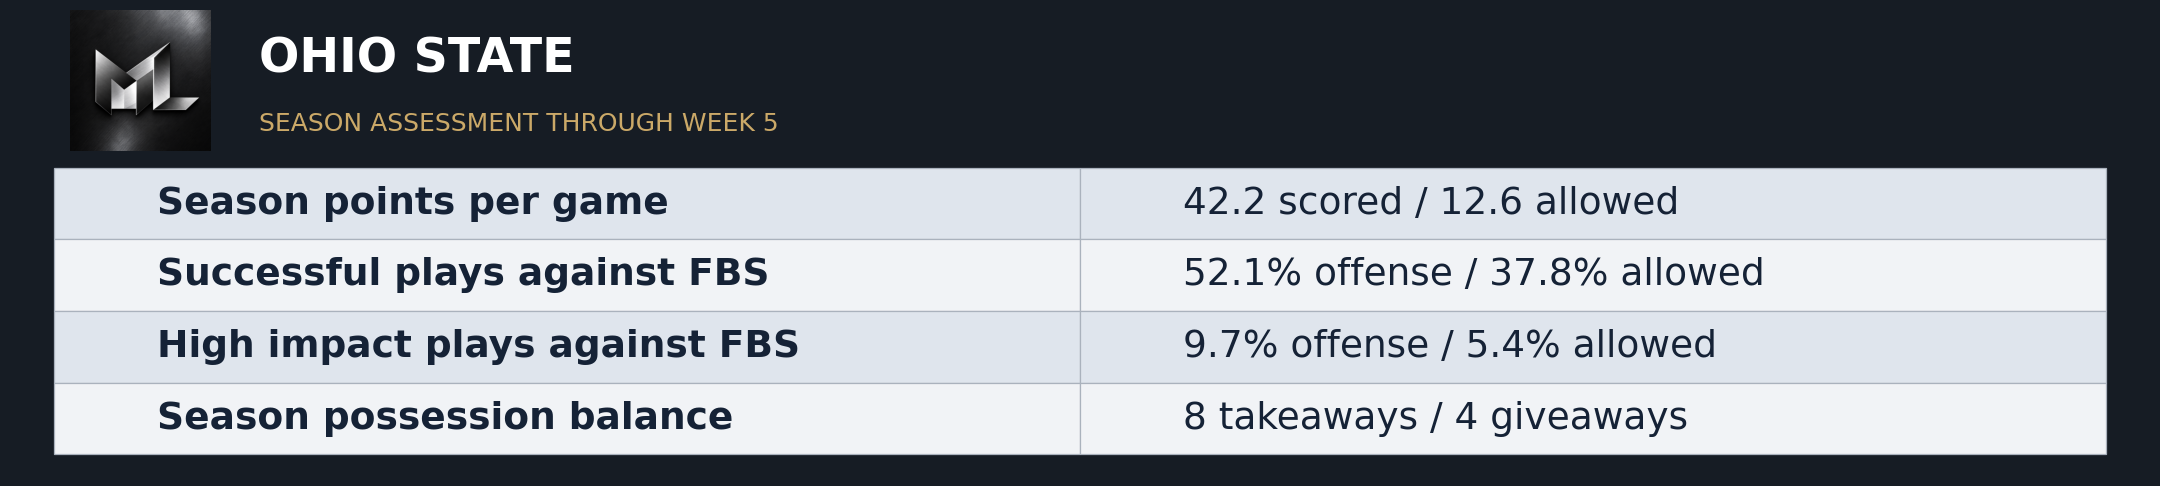
Ohio State has responded to its early loss with an offense that can create valuable passes and a defense that usually makes opponents work. Its season averages are 514.4 yards gained and 267 allowed. The offensive successful-play rate dipped to 38.1 percent in its second game, then returned above 52 percent in each of the next three. That is a recovery, not five weeks of uninterrupted consistency.
The 31-14 win at Iowa strengthened the case. Ohio State gained 484 yards, threw for 324, converted eight of 15 third downs and gave the ball away zero times. Iowa managed 39 rushing yards and turned it over twice. Friday's preview asked whether the Buckeyes could earn enough ordinary gains against Iowa's defense. They did, while also producing 12.0 yards per pass attempt.
The rushing attack still averaged only 3.4 yards per carry, and nine penalties complicated some possessions. The passing production did important repair work. Ohio State's defense has also allowed a wider weekly range of successful plays than its points average alone suggests. The Buckeyes have a strong balance of gains created and denied, but the cleaner version of this team would not need its passing game to keep overcoming avoidable long situations.
Across the season, qualifying stops have handed the offense an average start at its own 27.8 over 31 possessions. Game averages range from its own 16.5 to 42.0. In the narrower 17-possession sample without an identified return or penalty effect, the average is its own 24.8. Those stops usually leave substantial field to cover, even before judging the offense. The offense has produced an estimated 4.66 points before extra points per scoring opportunity. That payoff must be read alongside how often it can build the next drive.
| Season points per game | 42.2 scored / 12.6 allowed |
| Successful plays against FBS | 52.1% offense / 37.8% allowed |
| High impact plays against FBS | 9.7% offense / 5.4% allowed |
| Season possession balance | 8 takeaways / 4 giveaways |
Iowa
4-1 overall | Preview AP No. 14 | Matchup Lab No. 33 | Index 58.8
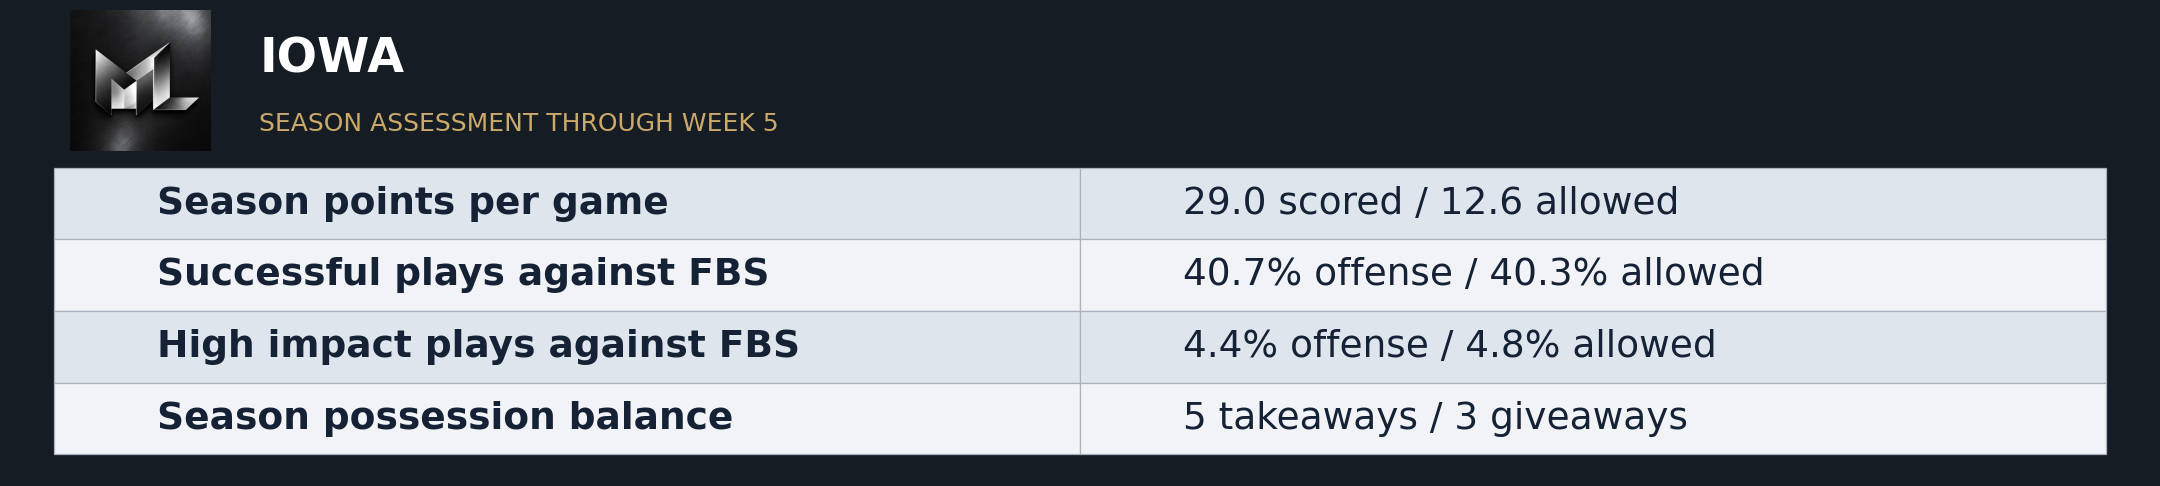
Iowa's first loss exposed the shrinking separation between its offense and defense. Across its charted FBS games, it now produces successful plays at 40.7 percent and allows 40.3 percent. The defense's weekly allowance has risen from 25.9 and 32.1 percent to 45.6 and 52.1 percent. Those are different opponents, but the direction explains why a previously attractive scoring margin became harder to maintain.
Ohio State's 31-14 win was not simply a turnover story. Iowa lost the ball twice, but was also outgained 484-238 and rushed for only 39 yards. The Buckeyes repeatedly extended drives and averaged 12 yards per pass attempt. Iowa's five third-down conversions on 11 tries did not compensate for the lack of useful rushing production or the damaging gains allowed.
Friday's preview framed Iowa's chance around making Ohio State earn every yard. That standard was not met. Iowa's first four turnover margins were positive or even; Saturday's minus two removed another cushion. With its offensive high-impact-play rate only 4.4 percent in the FBS sample, this team cannot confidently replace stalled drives with sudden scores. It needs field position and defensive stops to create manageable work, then a more dependable running game to complete it.
Across the season, qualifying stops have handed the offense an average start at its own 32.7 over 36 possessions. Game averages range from its own 26.5 to 40.2. In the narrower 23-possession sample without an identified return or penalty effect, the average is its own 30.1. The stops provide opportunities, but generally still leave a long drive to complete. The offense has produced an estimated 3.90 points before extra points per scoring opportunity. That payoff must be read alongside how often it can build the next drive.
| Season points per game | 29.0 scored / 12.6 allowed |
| Successful plays against FBS | 40.7% offense / 40.3% allowed |
| High impact plays against FBS | 4.4% offense / 4.8% allowed |
| Season possession balance | 5 takeaways / 3 giveaways |
Tennessee
4-1 overall | Preview AP No. 17 | Matchup Lab No. 17 | Index 65.7
Tennessee's season profile remains more persuasive on big plays and scoring outcomes than on steady offensive progress. It averages 240.6 rushing yards, but its successful-play rate is only marginally above the rate it allows. The offensive weekly range runs from 32.9 to 53.7 percent. A strong rushing total can therefore include stretches where the offense struggles to keep a drive alive.
The 24-14 win over Auburn illustrated the distinction. DeSean Bishop supplied all three touchdowns, including scoring runs of 25 and 44 yards. Tennessee finished with 237 rushing yards but only 86 passing, and converted three of 14 third downs. Two fourth-down conversions helped. The touchdown runs mattered because the ordinary route was not consistently working.
Auburn's three giveaways, compared with Tennessee's two, helped the Volunteers survive another uneven offensive day. Auburn still rushed for 186 yards at 5.8 per attempt. Tennessee's season defensive scoring average of 15.2 is valuable, but the latest result does not mean opponents are unable to move it. Friday's preview emphasized the contrast between explosive offense and sustained progress. Saturday left that distinction intact. Bishop found the end zone; the third-down offense is still looking for directions.
Across the season, qualifying stops have handed the offense an average start at its own 30.9 over 34 possessions. Game averages range from its own 20.8 to 36.6. In the narrower 25-possession sample without an identified return or penalty effect, the average is its own 28.4. The stops provide opportunities, but generally still leave a long drive to complete. The offense has produced an estimated 4.78 points before extra points per scoring opportunity. That payoff must be read alongside how often it can build the next drive.
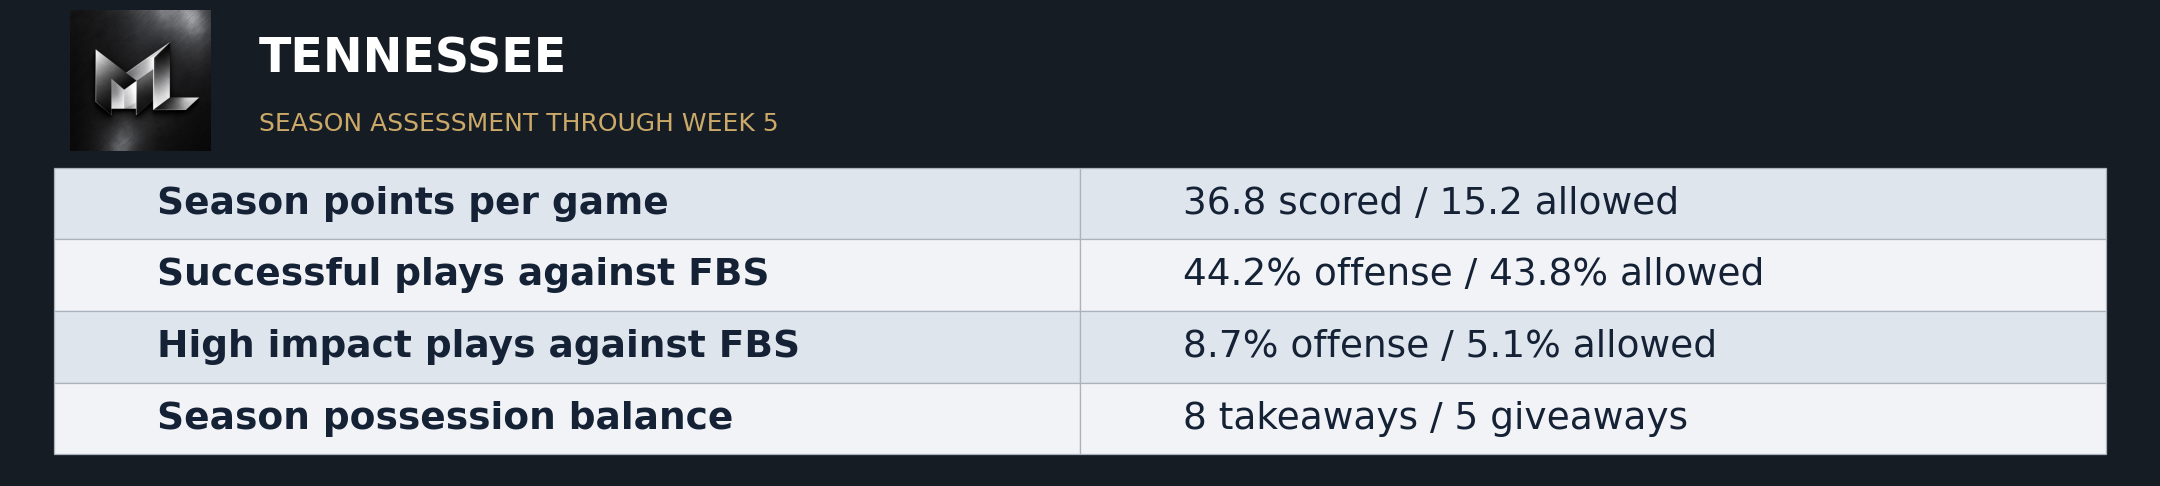
| Season points per game | 36.8 scored / 15.2 allowed |
| Successful plays against FBS | 44.2% offense / 43.8% allowed |
| High impact plays against FBS | 8.7% offense / 5.1% allowed |
| Season possession balance | 8 takeaways / 5 giveaways |
Florida
4-1 overall | Preview AP No. 8 | Matchup Lab No. 43 | Index 56.3
Florida's defensive warning has been present for longer than one bad Saturday. Opponents now produce successful plays slightly more often than the Gators do in the FBS sample, and also generate a greater share of high-impact plays. Florida averages 46.2 points, but allows 27.2. That is a team whose offense has often been asked to outrun a problem rather than remove it.
Missouri's 45-17 win stripped away the offensive cushion without any turnover explanation. Neither team gave the ball away. Florida rushed for 42 yards, gained 325 overall and allowed 560. Jon Sumrall said, 'We knew a couple of things were coming and still didn't stop it.' The 220 rushing yards and 340 passing yards allowed support that assessment rather directly.
Friday's preview identified defensive resistance as the test, even while recognizing Florida's scoring power. Missouri passed it on both sides. Florida's offensive successful-play rate fell to 39.1 percent after a much stronger preceding game. Its season finishing return remains healthy when it reaches the right territory, but fewer sustained possessions make that strength harder to use. The correction is broader than one coverage call. Florida needs useful early offense and a defense that can protect it when 40 points are unavailable.
Across the season, qualifying stops have handed the offense an average start at its own 30.1 over 22 possessions. Game averages range from its own 23.3 to 37.2. In the narrower 17-possession sample without an identified return or penalty effect, the average is its own 30.5. The stops provide opportunities, but generally still leave a long drive to complete. The offense has produced an estimated 5.11 points before extra points per scoring opportunity. That payoff must be read alongside how often it can build the next drive.
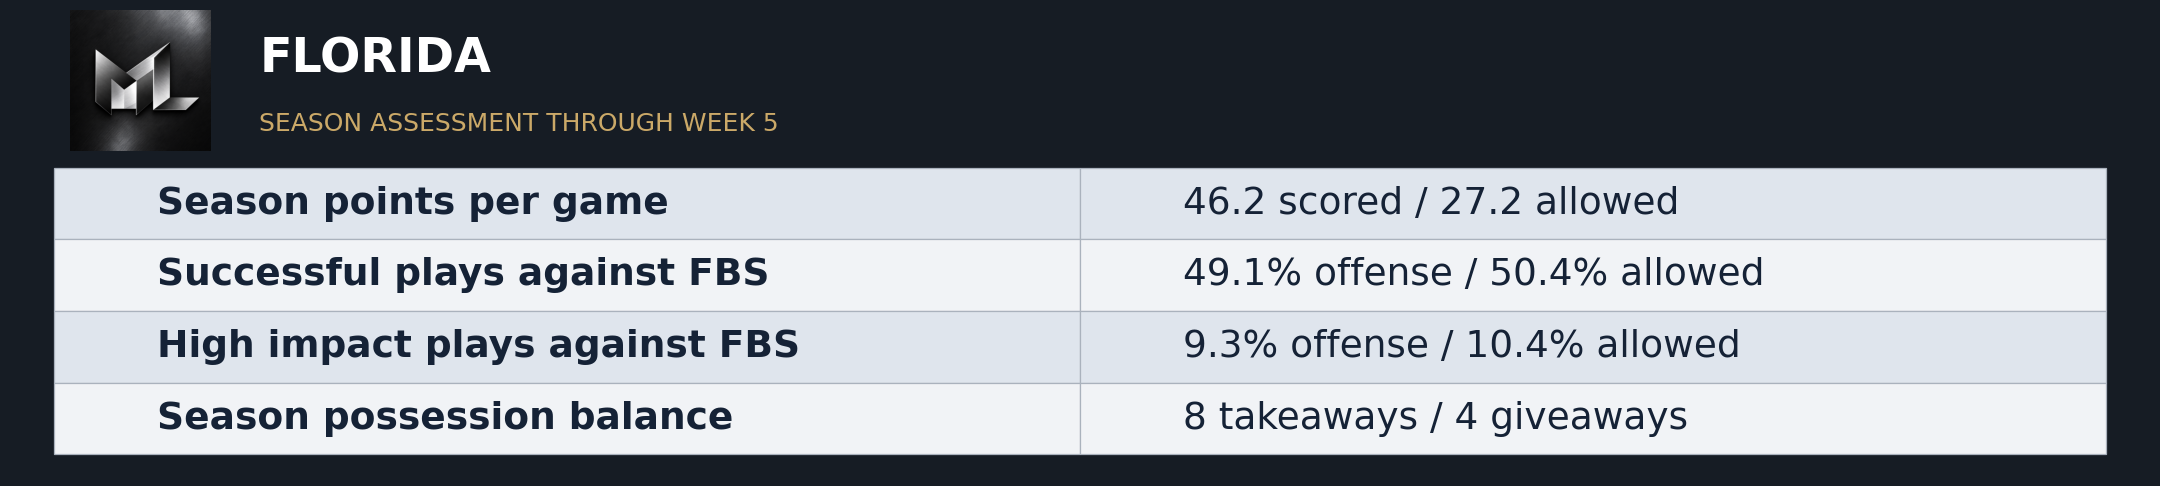
| Season points per game | 46.2 scored / 27.2 allowed |
| Successful plays against FBS | 49.1% offense / 50.4% allowed |
| High impact plays against FBS | 9.3% offense / 10.4% allowed |
| Season possession balance | 8 takeaways / 4 giveaways |
Missouri
4-1 overall | Preview AP No. 25 | Matchup Lab No. 20 | Index 64.3
Missouri's season has become more encouraging on offense while remaining uneven on defense. Its charted offensive successful-play rate has improved from the upper 30s into the upper 40s over its latest games. The defensive allowance jumped against Mississippi State before falling again against Florida. That is evidence of improvement and volatility together, not a reason to choose only the most flattering Saturday.
The 45-17 Florida win was especially useful because no turnover helped either side. Missouri gained 560 yards, including 220 rushing, and converted seven of 13 third downs. Florida was held to 42 rushing yards and 325 overall. The Tigers created a scoring advantage through their own possessions and defensive resistance rather than waiting for extra ones.
The larger season still includes an estimated 3.95 offensive points per scoring opportunity before extra points. Saturday therefore improves the finishing argument without proving the earlier empty trips are gone. Friday's preview asked whether Missouri could turn favorable territory into touchdowns while slowing Florida's balance. It did. The meaningful next step is repeating enough of that work when the offense does not enjoy 11.3 yards per pass attempt. A statement win becomes a habit only after the statement gets repeated.
Across the season, qualifying stops have handed the offense an average start at its own 35.8 over 36 possessions. Game averages range from its own 25.2 to 50.7. In the narrower 29-possession sample without an identified return or penalty effect, the average is its own 37.4. That is useful territorial support, although the opponent's kicking remains part of it. The offense has produced an estimated 3.95 points before extra points per scoring opportunity. That payoff must be read alongside how often it can build the next drive.
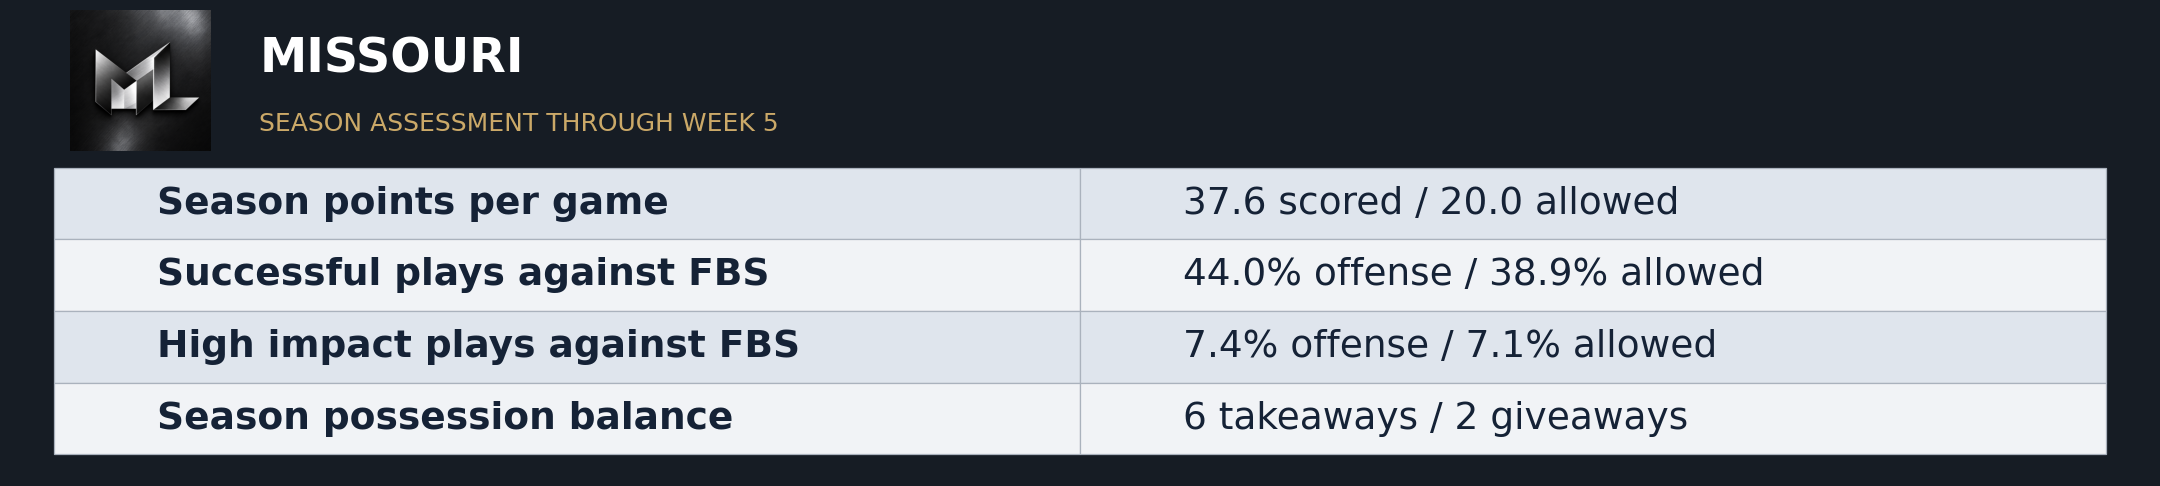
| Season points per game | 37.6 scored / 20.0 allowed |
| Successful plays against FBS | 44.0% offense / 38.9% allowed |
| High impact plays against FBS | 7.4% offense / 7.1% allowed |
| Season possession balance | 6 takeaways / 2 giveaways |
Kentucky
4-1 overall | Preview AP No. 24 | Matchup Lab No. 27 | Index 62.2
Kentucky's offense has recovered from its low point against Alabama, while its defense remains less predictable. After a 33.3 percent offensive successful-play rate in that charted game, its next three were above 52 percent. Defensive results have swung more sharply. The Wildcats' five-game turnover balance is plus five, and that possession advantage has helped them survive games in which opponents move the ball well.
The 35-34 overtime escape at South Carolina made both sides of the profile visible. Kentucky gave the ball away zero times and recovered two Gamecocks fumbles, yet was outgained 458-394. South Carolina rushed for 232 yards and converted half its third downs. Kentucky converted only four of 14 third downs but both fourth-down attempts, then won on the two-point conversion.
Friday's preview warned that Kentucky could not rely on repeatedly rescuing third down. That concern remains. The Wildcats found enough alternative routes to finish the game, but those routes included takeaways, fourth downs and an overtime decision. The offense's recent early-play improvement is real evidence; the defense's inability to prevent long productive stretches is also real. Kentucky earned the win. It did not earn a quiet review of the first 60 minutes.
Across the season, qualifying stops have handed the offense an average start at its own 31.3 over 25 possessions. Game averages range from its own 10.0 to 37.6. In the narrower 18-possession sample without an identified return or penalty effect, the average is its own 34.0. That is useful territorial support, although the opponent's kicking remains part of it. The offense has produced an estimated 4.31 points before extra points per scoring opportunity. That payoff must be read alongside how often it can build the next drive.
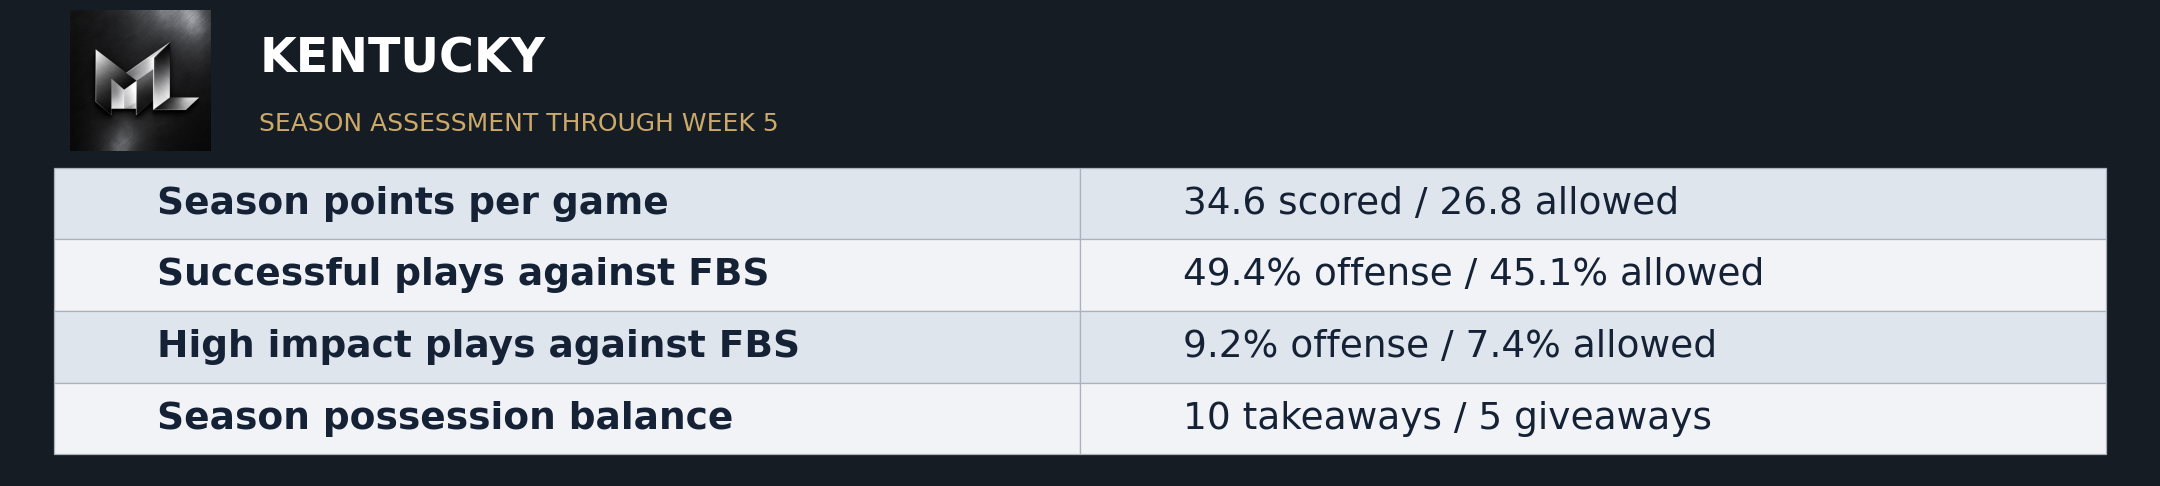
| Season points per game | 34.6 scored / 26.8 allowed |
| Successful plays against FBS | 49.4% offense / 45.1% allowed |
| High impact plays against FBS | 9.2% offense / 7.4% allowed |
| Season possession balance | 10 takeaways / 5 giveaways |
BYU
4-0 overall | Preview AP No. 10 | Matchup Lab No. 15 | Index 67.0
BYU's season remains grounded in rushing production, defensive resistance and a positive possession balance, but the offense has not delivered the same standard every week. Its charted successful-play rate has ranged from 37.0 to 61.8 percent. The Cougars allow 75 rushing yards per game and have seven takeaways against two giveaways, although four of their five net takeaways came in the opener.
The 17-10 win at TCU required a different level of patience. BYU gained only 216 yards and passed for 62 after LJ Martin left early. Kalani Sitake called it 'a gritty win.' A late 72-yard touchdown drive gives that phrase substance. It also accounted for one-third of BYU's total yardage, which makes the rest of the evening harder to describe as comfortable.
The other touchdown followed a fourth-down interception and a 59-yard return, leaving only 16 yards to travel. That was a valuable defensive play and return, not proof the offense had solved TCU. Friday's preview questioned how easily BYU's rushing attack would operate against this front. The difficulty was real. BYU protected the ball and finished the decisive possession, but needs more reliable passing support before treating this escape as a complete offensive answer.
Across the season, qualifying stops have handed the offense an average start at its own 28.7 over 25 possessions. Game averages range from its own 21.4 to 35.4. In the narrower 20-possession sample without an identified return or penalty effect, the average is its own 26.4. The stops provide opportunities, but generally still leave a long drive to complete. The offense has produced an estimated 4.73 points before extra points per scoring opportunity. That payoff must be read alongside how often it can build the next drive.
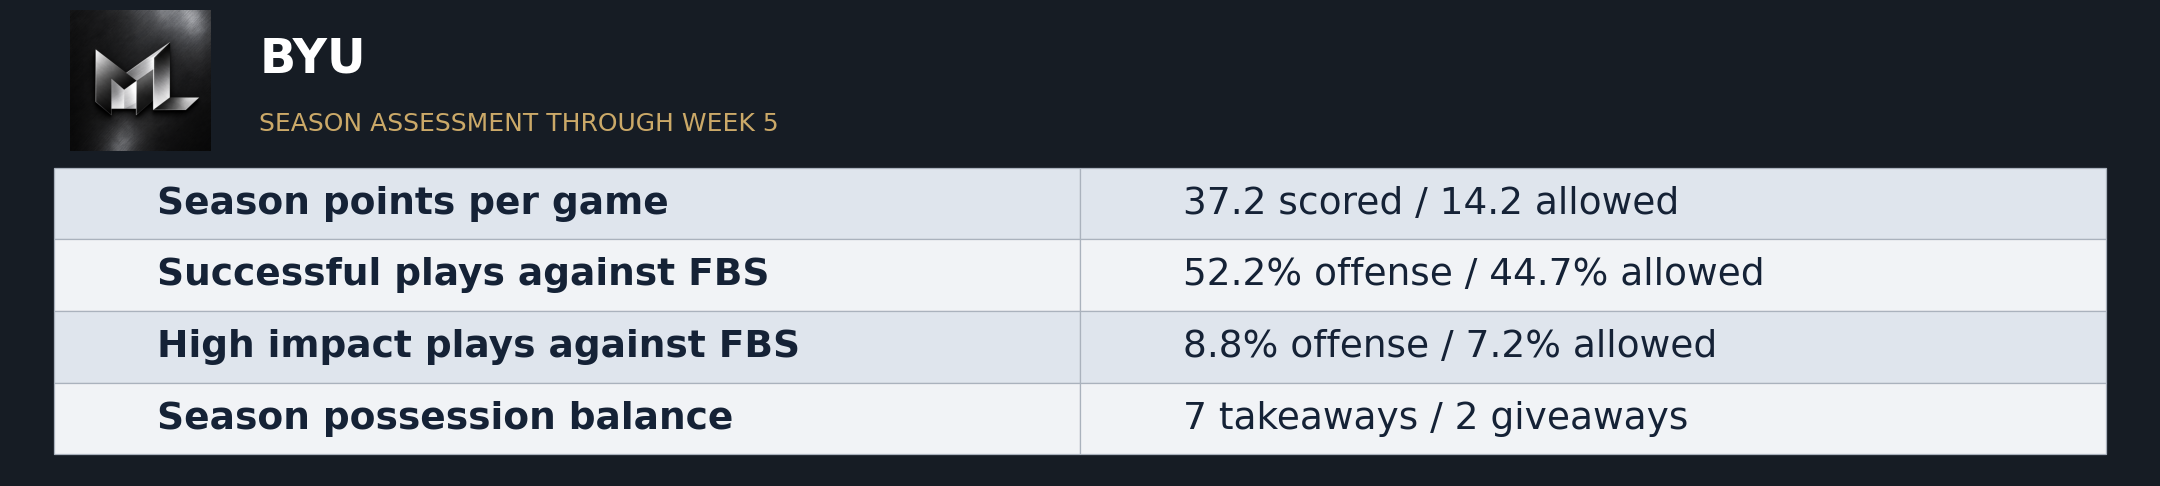
| Season points per game | 37.2 scored / 14.2 allowed |
| Successful plays against FBS | 52.2% offense / 44.7% allowed |
| High impact plays against FBS | 8.8% offense / 7.2% allowed |
| Season possession balance | 7 takeaways / 2 giveaways |
Boise State
4-1 overall | Preview AP No. 22 | Matchup Lab No. 35 | Index 58.7
Boise State's recent offensive progress is more convincing than its record alone. After a 40.6 percent successful-play rate in its opening charted game, its subsequent FBS rates have stayed above 50 percent. It averages 226.6 rushing yards and has not finished a game with a negative net turnover margin. The offense has increasingly supplied its own progress rather than depending entirely on defensive gifts.
The 37-18 Utah State win extended that case. Boise gained 429 yards, converted eight of 13 third downs and averaged 11.6 yards per pass attempt. A defensive interception return added a touchdown, but the regular offense also kept drives alive. Friday's preview asked whether Boise could force a limited opponent to keep driving while using its own ground game. The offense delivered enough balance to control the result.
The defensive review should remain less comfortable. Utah State gained 345 yards and rushed for 169 at 5.1 per attempt, and its charted successful-play rate reached 50 percent. Boise's season opponents still generate a slightly higher share of high-impact plays than the Broncos themselves. The defense helped produce points, but a scoring takeaway and repeatable resistance are separate things. Boise should keep the offensive improvement and demand fewer openings for the next opponent.
Across the season, qualifying stops have handed the offense an average start at its own 21.3 over 29 possessions. Game averages range from its own 16.2 to 24.6. In the narrower 26-possession sample without an identified return or penalty effect, the average is its own 22.0. Those stops usually leave substantial field to cover, even before judging the offense. The offense has produced an estimated 4.31 points before extra points per scoring opportunity. That payoff must be read alongside how often it can build the next drive.
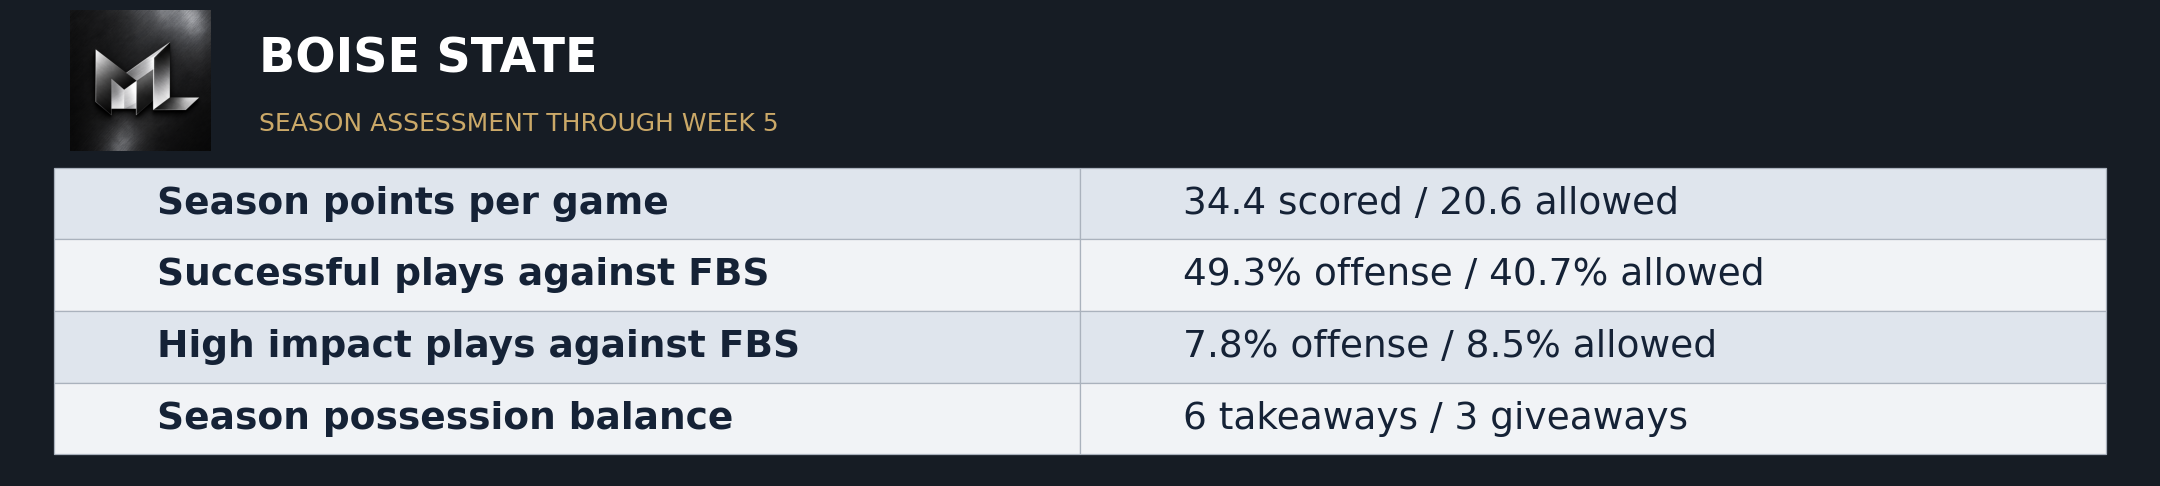
| Season points per game | 34.4 scored / 20.6 allowed |
| Successful plays against FBS | 49.3% offense / 40.7% allowed |
| High impact plays against FBS | 7.8% offense / 8.5% allowed |
| Season possession balance | 6 takeaways / 3 giveaways |
Miami
5-0 overall | Preview AP No. 4 | Matchup Lab No. 5 | Index 76.4
Miami's season is built on an offense that creates its own opportunities and a defense that largely removes the run. The Hurricanes average 554.8 yards and allow 42.6 rushing yards. Their high-impact-play rate is only 5.7 percent against FBS opponents, yet their successful-play rate is 54.3 percent. That combination points toward useful ordinary gains rather than a scoring profile wholly dependent on spectacular plays.
The 41-13 win at Clemson preserved those strengths. Miami rushed for 192 yards, committed no turnovers and limited Clemson to 55 rushing yards. Darian Mensah said that leaving points behind 'makes me sick.' Four conversions on 11 third downs and a failed fourth down provide reasons to review the missed chances even in a four-touchdown victory.
Clemson still gained 350 yards and converted eight third downs. Miami's advantage was not that every defensive snap worked, but that the Tigers struggled to turn movement into enough points while making two turnovers and committing 10 penalties. Friday's preview warned that improved Clemson defense might still be insufficient against sustained Miami offense. That held. Miami has now produced offensive successful-play rates above 58 percent in its latest two charted games, but its earlier Wake Forest dip remains a reminder that the best version is not automatic.
Across the season, qualifying stops have handed the offense an average start at its own 29.3 over 38 possessions. Game averages range from its own 16.7 to 34.7. In the narrower 33-possession sample without an identified return or penalty effect, the average is its own 29.1. The stops provide opportunities, but generally still leave a long drive to complete. The offense has produced an estimated 4.79 points before extra points per scoring opportunity. That payoff must be read alongside how often it can build the next drive.
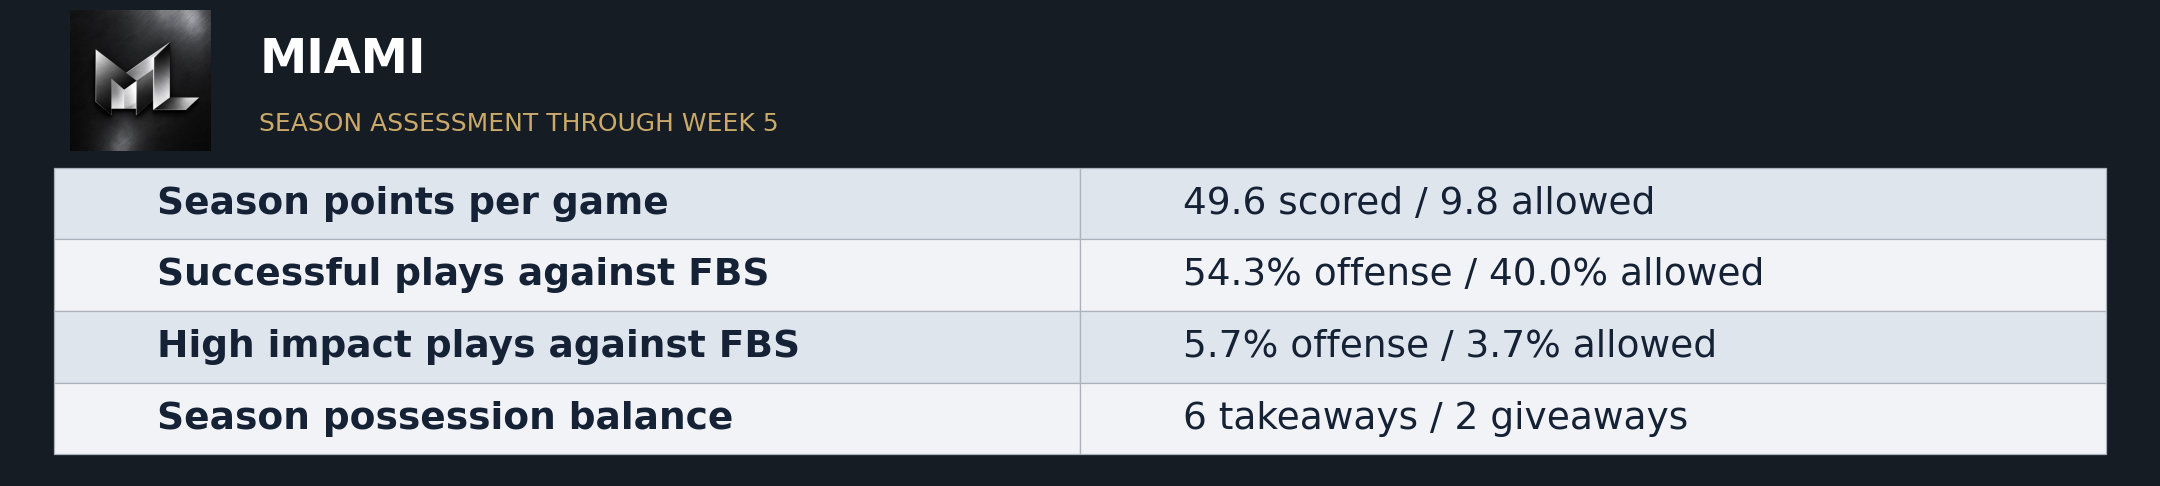
| Season points per game | 49.6 scored / 9.8 allowed |
| Successful plays against FBS | 54.3% offense / 40.0% allowed |
| High impact plays against FBS | 5.7% offense / 3.7% allowed |
| Season possession balance | 6 takeaways / 2 giveaways |
Texas Tech
5-0 overall | Preview AP No. 12 | Matchup Lab No. 56 | Index 53.3
Texas Tech is unbeaten, but its season performance is considerably less settled than 5-0 suggests. Its charted offensive successful-play rate has ranged from 33.3 to 53.8 percent, while the defense has alternated between strong resistance and much more permissive games. The latest win moved the possession balance from negative for the season to positive. It did not establish five weeks of clean, repeatable control.
The 29-7 Colorado result is the clearest example. Texas Tech gained 315 yards to Colorado's 375 and converted three of 12 third downs, with neither fourth-down attempt successful. Four interceptions, including a touchdown return, supplied a very different kind of advantage. Joey McGuire called it 'some really ugly football at times.' The conversion numbers did not argue.
Friday's preview asked for ordinary possessions and cleaner ball security. Tech delivered the latter, with no giveaways, while the former remained uneven. Colorado's mistakes cannot become an offensive plan for the next opponent. The defense deserves credit for the takeaways and for holding Colorado to seven, but allowing successful plays on 55 percent of charted snaps is a different story from consistently smothering an offense. The final was comfortable. The route deserves a longer conversation.
Across the season, qualifying stops have handed the offense an average start at its own 28.5 over 36 possessions. Game averages range from its own 18.0 to 42.8. In the narrower 26-possession sample without an identified return or penalty effect, the average is its own 27.7. The stops provide opportunities, but generally still leave a long drive to complete. The offense has produced an estimated 4.15 points before extra points per scoring opportunity. That payoff must be read alongside how often it can build the next drive.
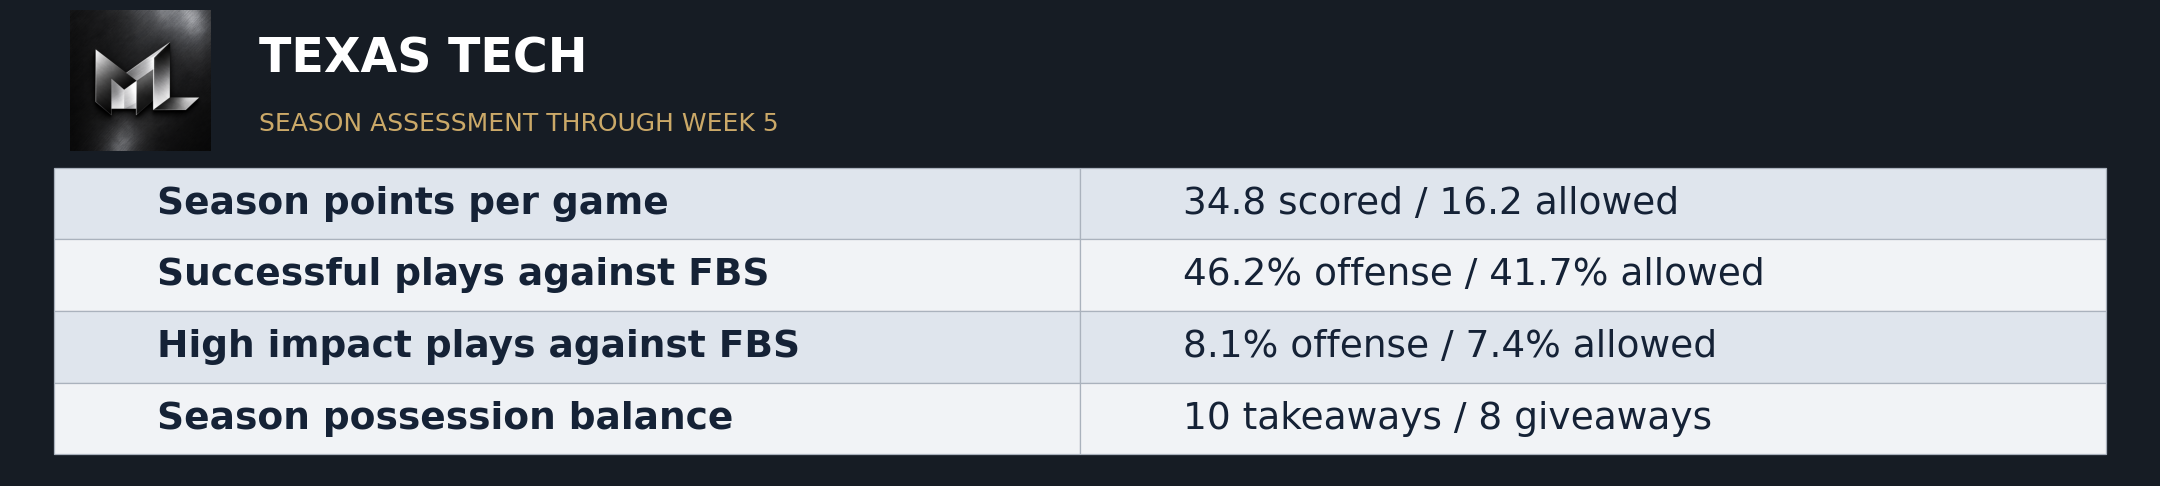
| Season points per game | 34.8 scored / 16.2 allowed |
| Successful plays against FBS | 46.2% offense / 41.7% allowed |
| High impact plays against FBS | 8.1% offense / 7.4% allowed |
| Season possession balance | 10 takeaways / 8 giveaways |
USC
5-1 overall | Preview AP No. 18 | Matchup Lab No. 58 | Index 52.8
USC's season has combined a useful offense with a defense that has too often allowed the next answer. Its offensive successful-play rate is 53.7 percent, but opponents have produced high-impact plays at 10.7 percent, well above USC's 7.1 percent. Six games have produced six giveaways and five takeaways. The Trojans have not enjoyed a dependable possession cushion that explains away the defensive concerns.
The 25-21 win over Washington was a meaningful defensive improvement. Washington converted one of 12 third downs, and Jahkeem Stewart's fumble return supplied the go-ahead touchdown. USC gained 360 yards and held the ball for nearly 35 minutes, but nine penalties for 94 yards and only five third-down conversions kept the offense from creating comfortable separation.
Lincoln Riley said the Trojans were 'really outplaying them' for a long stretch. The defense and possession time support part of that case; the penalties explain why it still needed a defensive score. Friday's preview highlighted Washington's difficulty sustaining drives and USC's vulnerable coverage. Both appeared, including a long Washington touchdown. USC improved the latest defensive successful-play allowance to 35.7 percent after three charted weeks at 50 percent or worse. The next task is to repeat that improvement without another emergency touchdown.
Across the season, qualifying stops have handed the offense an average start at its own 31.7 over 25 possessions. Game averages range from its own 21.6 to 48.0. In the narrower 13-possession sample without an identified return or penalty effect, the average is its own 26.0. The stops provide opportunities, but generally still leave a long drive to complete. The offense has produced an estimated 4.35 points before extra points per scoring opportunity. That payoff must be read alongside how often it can build the next drive.
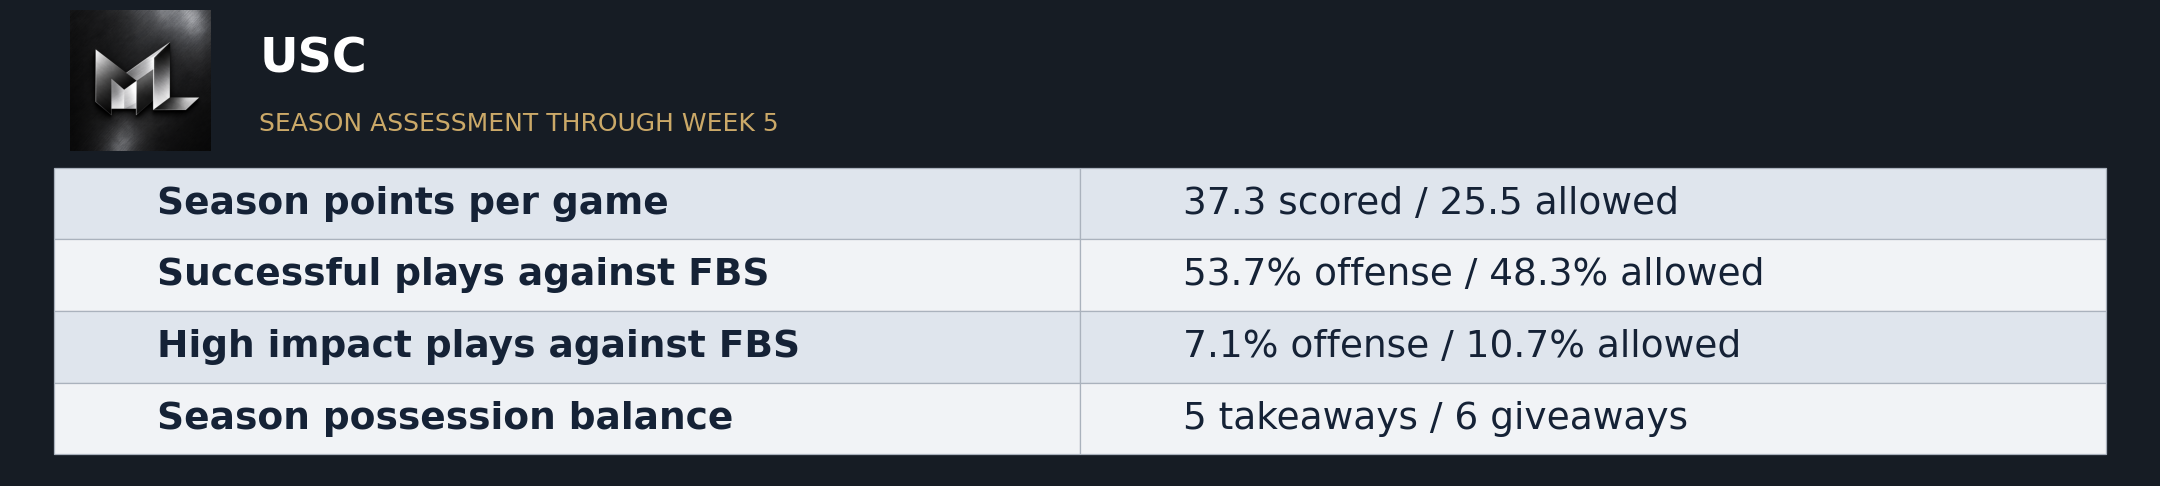
| Season points per game | 37.3 scored / 25.5 allowed |
| Successful plays against FBS | 53.7% offense / 48.3% allowed |
| High impact plays against FBS | 7.1% offense / 10.7% allowed |
| Season possession balance | 5 takeaways / 6 giveaways |
LSU
4-1 overall | Preview AP No. 11 | Matchup Lab No. 9 | Index 73.7
LSU's season case is strongest on defense. The Tigers allow 220.6 yards and 58.4 rushing yards per game, and their FBS opponents generate successful plays on only 33.5 percent of snaps. The offense has been less uniformly persuasive beneath its scoring totals. Its charted FBS successful-play rate stepped down from 49.5 to 44.7, 44.9 and 40.9 percent before this week's FCS matchup.
The 63-14 win over McNeese produced 731 yards, 39 first downs and 367 rushing yards. LSU converted all three fourth downs and held McNeese to one third-down conversion in 12 attempts. Those are useful execution details. They also came against a different level of opposition, exactly the caution raised in Friday's preview. McNeese does not enter the FBS-only successful-play sample used above.
LSU lost and gained one turnover, leaving its season balance even at eight each. Its scoring-opportunity return still leaves room to improve against more demanding opponents. The latest total should not erase that distinction. The performance index can fall after a large win because it re-evaluates the full opponent network, standardizes against all FBS teams and caps a game's influence. This result supplied a productive afternoon, not a new reason to ignore what happened against stronger opposition.
Across the season, qualifying stops have handed the offense an average start at its own 30.6 over 37 possessions. Game averages range from its own 21.6 to 40.3. In the narrower 30-possession sample without an identified return or penalty effect, the average is its own 29.4. The stops provide opportunities, but generally still leave a long drive to complete. The offense has produced an estimated 4.16 points before extra points per scoring opportunity. That payoff must be read alongside how often it can build the next drive.
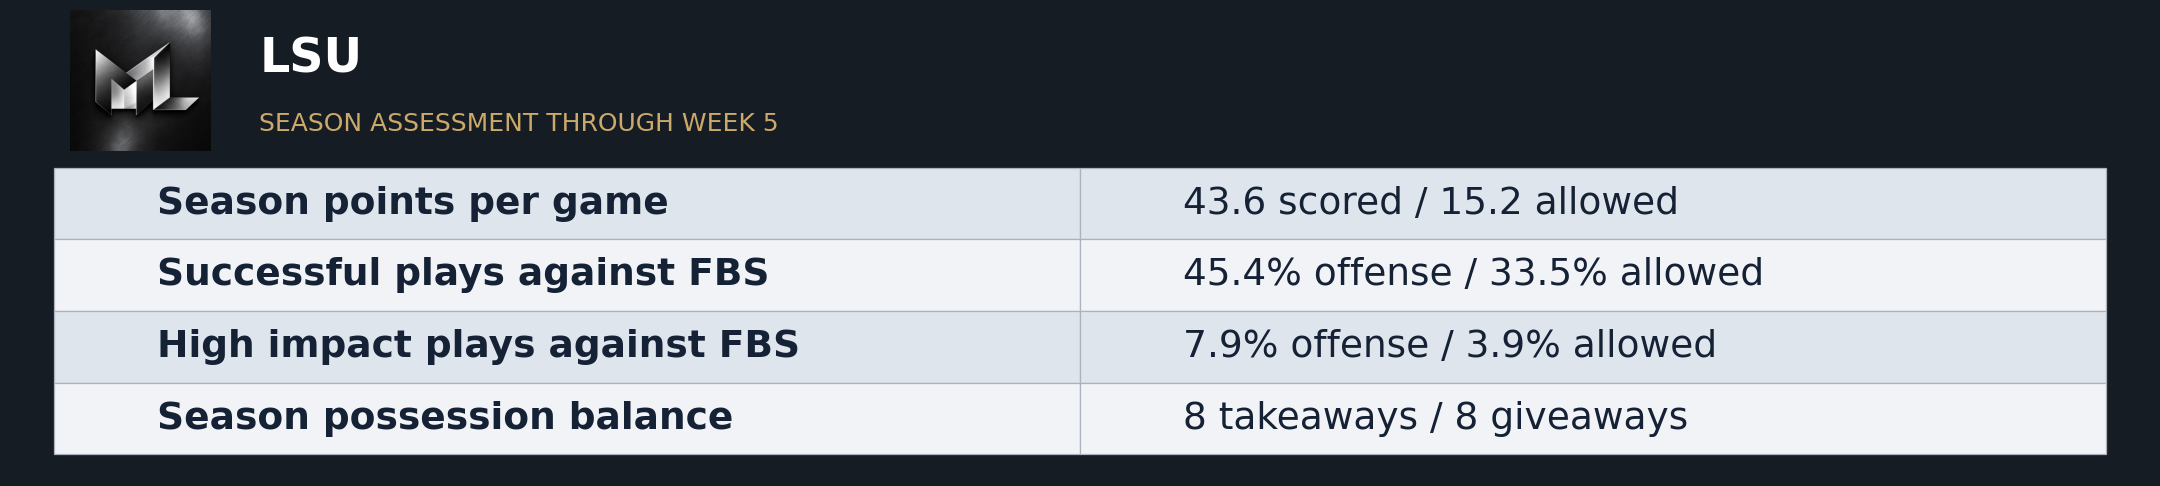
| Season points per game | 43.6 scored / 15.2 allowed |
| Successful plays against FBS | 45.4% offense / 33.5% allowed |
| High impact plays against FBS | 7.9% offense / 3.9% allowed |
| Season possession balance | 8 takeaways / 8 giveaways |
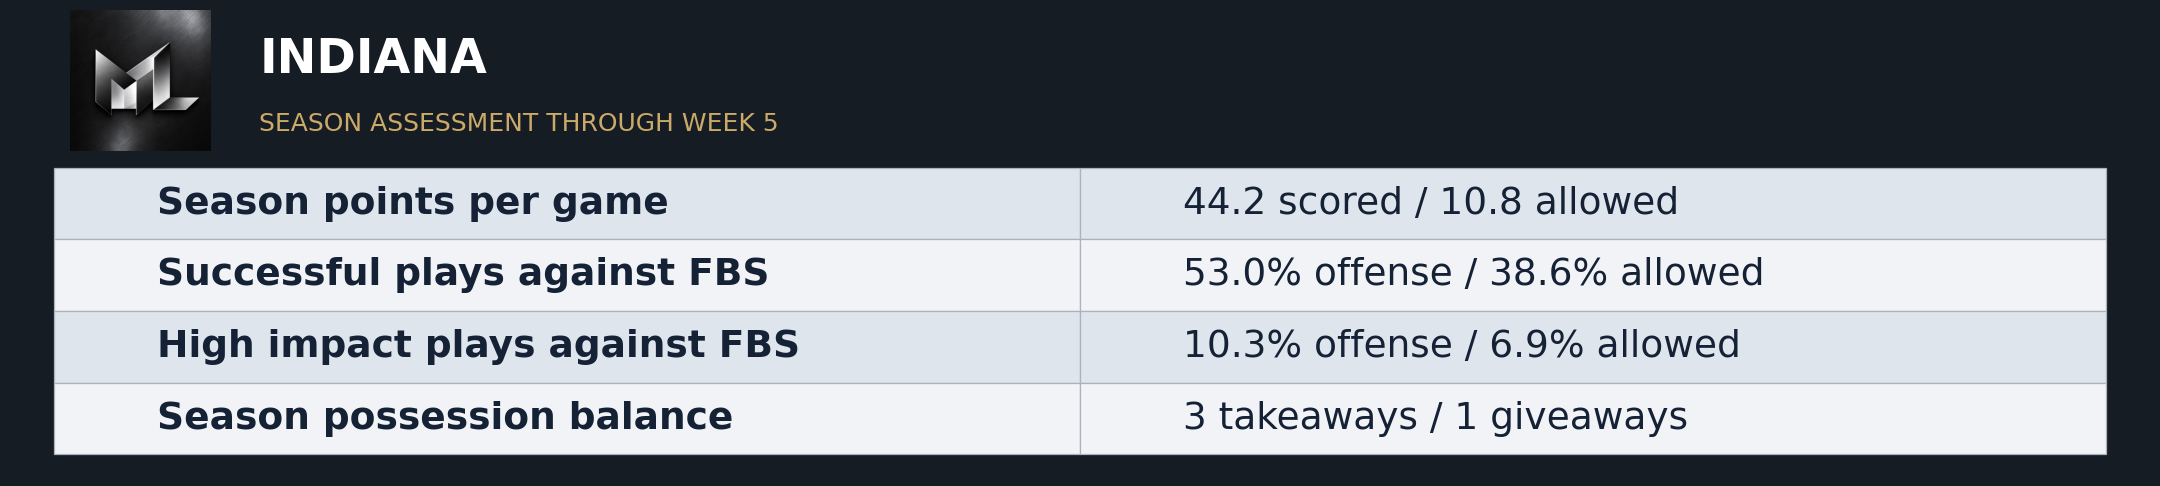
Indiana
5-0 overall | Preview AP No. 6 | Matchup Lab No. 7 | Index 75.9
Indiana's season has been built on rushing production and defensive resistance with remarkably little reliance on net takeaways. Through five games it has one giveaway and three takeaways, averages 252.6 rushing yards and allows 64.4. The offense has won useful downs often enough that the 29-23 Northwestern game did not require treating the entire operation as broken.
The 47-15 Rutgers win restored a much larger margin. Indiana gained 593 yards, rushed for 329 and committed neither a turnover nor a penalty. Rutgers converted two of 14 third downs and gained only 59 rushing yards. Both teams finished without a giveaway, so the separation came from the possessions themselves. Friday's preview asked whether Rutgers could reproduce its previous scoring burst against a better defense. It could not.
The caution is to keep the scoring margin distinct from every underlying snap. Indiana's charted high-impact-play allowance remains meaningful, and the Rutgers game did not make every defensive rate better. The Hoosiers nevertheless have strong season evidence of limiting the run, preserving the ball and finishing enough drives. Their latest offensive successful-play rate jumped above the earlier band. That is a higher ceiling demonstrated once; the season's value remains the useful floor beneath it.
Across the season, qualifying stops have handed the offense an average start at its own 27.5 over 34 possessions. Game averages range from its own 21.5 to 41.7. In the narrower 32-possession sample without an identified return or penalty effect, the average is its own 26.1. The stops provide opportunities, but generally still leave a long drive to complete. The offense has produced an estimated 4.77 points before extra points per scoring opportunity. That payoff must be read alongside how often it can build the next drive.
| Season points per game | 44.2 scored / 10.8 allowed |
| Successful plays against FBS | 53.0% offense / 38.6% allowed |
| High impact plays against FBS | 10.3% offense / 6.9% allowed |
| Season possession balance | 3 takeaways / 1 giveaways |