
BYU Cougars at UCF Knights
2026-10-23 · Time TBD · Scheduled
 BYU Cougars4-0
 UCF Knights3-2
ESPN standings data retrieved October 6, 2026. 2026 season totals at this snapshot.
| Measure | BYU Cougars | UCF Knights |
|---|---|---|
| Record | 4-0 | 3-2 |
| Points scored / game | 37.2 | 32.4 |
| Points allowed / game | 14.2 | 17.6 |
| Points differential | +92 | +74 |
How this game can be won
BYU Cougars average 37.2 points scored and 14.2 allowed; UCF Knights average 32.4 scored and 17.6 allowed. The first question is whether each offense can make ordinary downs useful. Repeated manageable gains keep more of the playbook available.
Watch the long gains separately. An offense can move steadily without breaking a big play, or spend an afternoon waiting for one big play to rescue it. The more repeatable approach is the one that can still move the ball when the defense removes its easiest option.
Field position changes the job. Starting near midfield means fewer yards are needed before a scoring chance. Once the drive reaches threatening territory, watch whether the offense finishes it with useful points instead of wasting the trip.
Finally, count the lost possessions. Turnovers can change a close game without explaining every down that came before them. Our football model needs efficiency, explosive-play rate, starting field position, drive finishing and turnover margin together. A scoring average or a third-down rate cannot replace that set.
Closer to game day
Spreads and win probabilities are reserved for confirmed games within the next seven days. This game stays on the schedule; its forecast opens inside that window.
BYU Cougars · our 2026-10-04 assessment
BYU
4-0 overall | Preview AP No. 10 | Matchup Lab No. 15 | Index 67.0
BYU's season remains grounded in rushing production, defensive resistance and a positive possession balance, but the offense has not delivered the same standard every week. Its charted successful-play rate has ranged from 37.0 to 61.8 percent. The Cougars allow 75 rushing yards per game and have seven takeaways against two giveaways, although four of their five net takeaways came in the opener.
The 17-10 win at TCU required a different level of patience. BYU gained only 216 yards and passed for 62 after LJ Martin left early. Kalani Sitake called it 'a gritty win.' A late 72-yard touchdown drive gives that phrase substance. It also accounted for one-third of BYU's total yardage, which makes the rest of the evening harder to describe as comfortable.
The other touchdown followed a fourth-down interception and a 59-yard return, leaving only 16 yards to travel. That was a valuable defensive play and return, not proof the offense had solved TCU. Friday's preview questioned how easily BYU's rushing attack would operate against this front. The difficulty was real. BYU protected the ball and finished the decisive possession, but needs more reliable passing support before treating this escape as a complete offensive answer.
Across the season, qualifying stops have handed the offense an average start at its own 28.7 over 25 possessions. Game averages range from its own 21.4 to 35.4. In the narrower 20-possession sample without an identified return or penalty effect, the average is its own 26.4. The stops provide opportunities, but generally still leave a long drive to complete. The offense has produced an estimated 4.73 points before extra points per scoring opportunity. That payoff must be read alongside how often it can build the next drive.
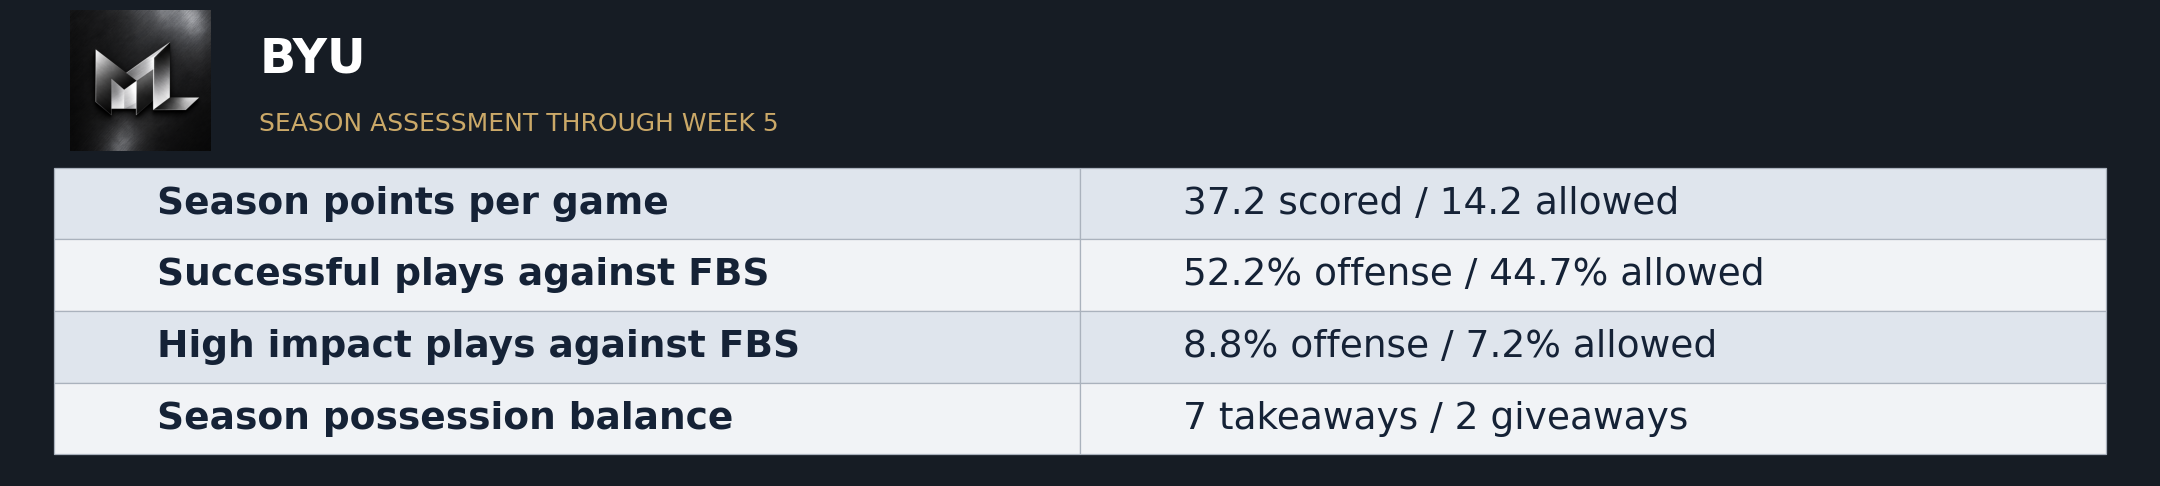
| Season points per game | 37.2 scored / 14.2 allowed |
| Successful plays against FBS | 52.2% offense / 44.7% allowed |
| High impact plays against FBS | 8.8% offense / 7.2% allowed |
| Season possession balance | 7 takeaways / 2 giveaways |
Our coverage of these teams
A matching published game video is not available in the verified archive yet.