Tennessee Titans 18 · Baltimore Ravens 24
Team assessments and season evidence from our Week 4 recap.
M&T Bank Stadium · 2026-10-04
The final score was Tennessee Titans 18 · Baltimore Ravens 24. The breakdown below uses this game’s figures, separate from season averages.
The scoring path
| Team | Q1 | Q2 | Q3 | Q4 | Final |
|---|---|---|---|---|---|
| Tennessee Titans | 7 | 0 | 3 | 8 | 18 |
| Baltimore Ravens | 7 | 17 | 0 | 0 | 24 |
| Measure | Tennessee Titans | Baltimore Ravens |
|---|---|---|
| First downs | 21 | 19 |
| Total yards | 297 | 384 |
| Yards per play | 5.1 | 6.3 |
| Passing yards | 212 | 272 |
| Rushing yards | 85 | 112 |
| Third-down conversions | 2-10 | 2-10 |
| Red-zone touchdowns / trips | 2-4 | 3-3 |
| Giveaways | 2 | 0 |
| Possession time | 26:52 | 33:08 |
Third-down conversion is shown as its own measure. It is not a substitute for overall play success rate. A dash means the source did not supply that field.
The Lab’s result test
Baltimore Ravens won by 6 points. Q2 supplied the largest scoring swing in the winner’s favor, a +17-points period. The chart shows the result’s path; the box score helps explain what created it.
Tennessee Titans produced 297 total yards; Baltimore Ravens produced 384. Yardage describes how much ground was gained, not whether the most valuable drives were finished.
Baltimore Ravens committed 0 giveaways against the opponent’s 2. That possession advantage gave the winner fewer mistakes to overcome.
The next test is repeatability. Separate staying on schedule from long gains, then examine field position and drive finishing. A large yardage total can coexist with missed scoring chances; a short field can make a modest drive valuable.
Our game coverage
A matching published game video is not available in the verified archive yet.
Game played 2026-10-04. These assessments cover the season through October 5, 2026, including this game.
Read the complete Week 4 article →
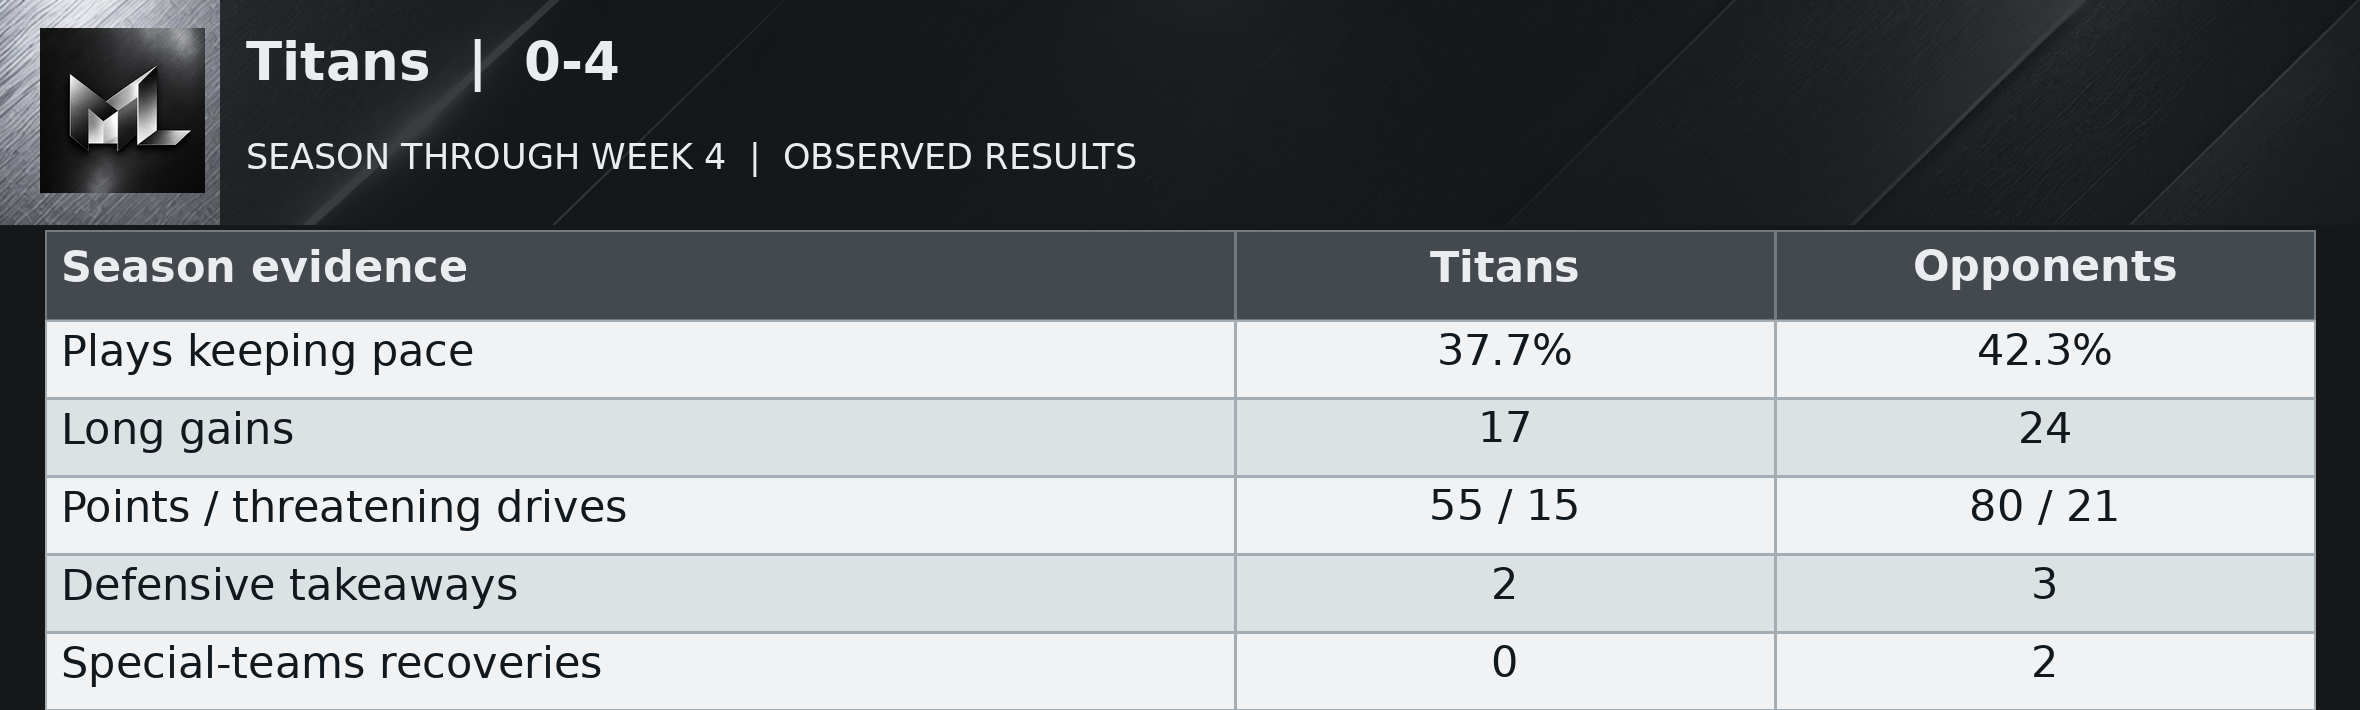
Titans | 0-4
Read the table as text
| Season evidence | Titans | Opponents |
|---|---|---|
| Plays keeping pace | 37.7% | 42.3% |
| Long gains | 17 | 24 |
| Points / threatening drives | 55 / 15 | 80 / 21 |
| Defensive takeaways | 2 | 3 |
| Special-teams recoveries | 0 | 2 |
Tennessee's offense has struggled to sustain movement in every game, with useful-play shares of 42.9, 37.3, 35.1 and 36.2 percent. It has created only 15 threatening possessions and produced 55 points from them. Opponents have generated 21 and returned 80. That gap exists even though the Titans have kept several scores close. Their five team giveaways include two special-teams mistakes, leaving three outside the return units. Both defensive takeaways came in Week 2, so extra possessions have not been a weekly resource.
The 24-18 loss at Baltimore provided five long gains and Carnell Tate's 145 receiving yards, but another two giveaways and a failed goal-line attempt interrupted the promise. Lamar Jackson's departure gave Tennessee a scoreless opponent after halftime; the Titans still could not erase the deficit. The late touchdown made the ending tense without solving the possessions that preceded it. At 0-4, Tennessee's repeated problem is creating and completing enough worthwhile drives. One receiver finding room does not make the rest of the offense dependable.
After opponent punts or failed fourth downs, Titans possessions have begun at their own 19.6, on average, across 17 competitive drives. The weekly average has stayed in a fairly narrow band, from their own 16.0 to their own 24.5. The latest game averaged their own 16.0. The resulting possession started at midfield or closer to the end zone in 0 of those 17 cases. These are actual starting spots, including punt returns, rather than a measure of the defense alone. The return unit has added 62 punt-return yards over the season. Starts following turnovers are counted separately: 2 competitive possessions at their opponent 46.5 on average.
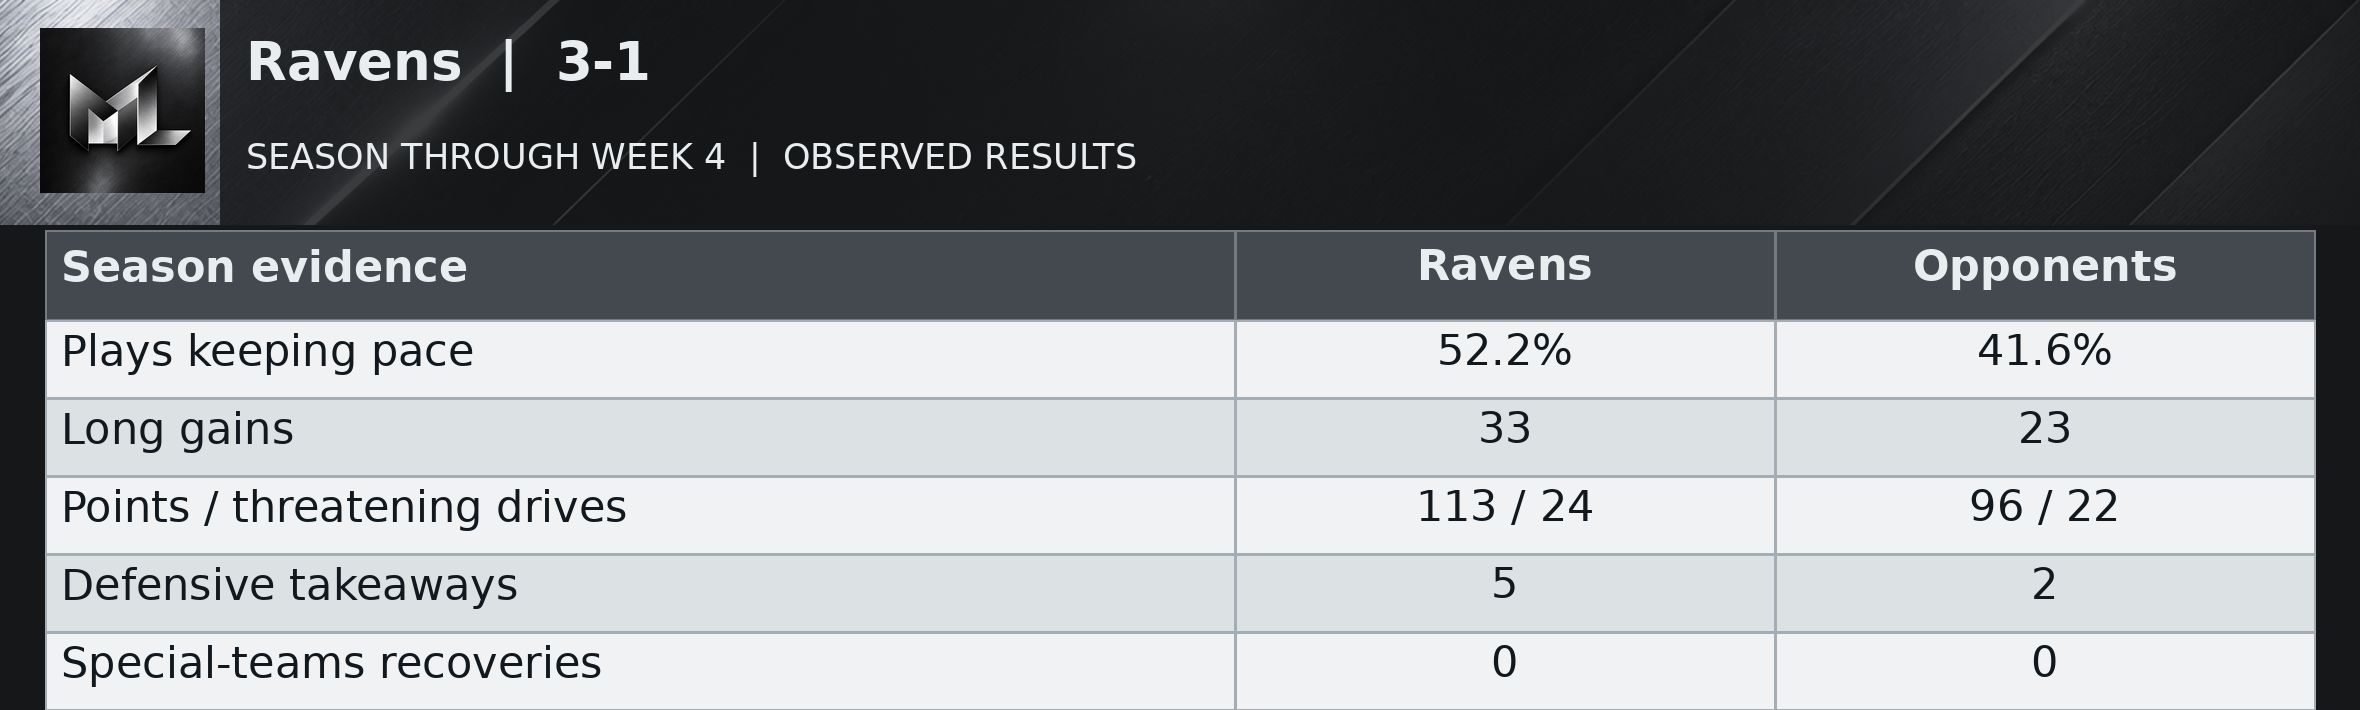
Ravens | 3-1
Read the table as text
| Season evidence | Ravens | Opponents |
|---|---|---|
| Plays keeping pace | 52.2% | 41.6% |
| Long gains | 33 | 23 |
| Points / threatening drives | 113 / 24 | 96 / 22 |
| Defensive takeaways | 5 | 2 |
| Special-teams recoveries | 0 | 0 |
Baltimore has consistently moved the ball better than its opponents, with useful gains on 52.2 percent of its plays against 41.6 percent allowed. Its 33 long gains are a real offensive weapon, but 23 allowed mean the defense has not removed the same escape route for opponents. The finishing has varied sharply, from 17 points on five threatening possessions in Week 2 to 21 on four Sunday. A separate long field goal supplied the other three points against Tennessee.
Jesse Minter said Baltimore played “more conservative in the second half”. With Lamar Jackson leaving injured and a 24-7 lead becoming a 24-18 finish, the explanation fits the circumstances; it does not turn a scoreless second half into a repeatable plan. Five defensive takeaways against two giveaways have helped, and neither total includes a return mistake. The goal-line stop was valuable, but the following touchdown required a 99-yard drive. Stopping someone and giving the offense a short field are different achievements.
After opponent punts or failed fourth downs, Ravens possessions have begun at their own 27.9, on average, across 18 competitive drives. The weekly average has varied widely, from their own 21.3 to their own 34.7. The latest game averaged their own 21.3. The resulting possession started at midfield or closer to the end zone in 2 of those 18 cases. These are actual starting spots, including punt returns, rather than a measure of the defense alone. The return unit has added 65 punt-return yards over the season. Pre-snap changes before the first run or pass affected 2 of these drives; those changes are excluded from the listed starting spots. Starts following turnovers are counted separately: 5 competitive possessions at their own 49.0 on average.
Week 4 daytime roundup
This is the multi-game edition, rather than a dedicated recap.