
Miami Dolphins 10 · Minnesota Vikings 15
Team assessments and season evidence from our Week 4 recap.
U.S. Bank Stadium · 2026-10-04
The final score was Miami Dolphins 10 · Minnesota Vikings 15. The breakdown below uses this game’s figures, separate from season averages.
 Miami Dolphins
 Minnesota Vikings
The scoring path
| Team | Q1 | Q2 | Q3 | Q4 | Final |
|---|---|---|---|---|---|
| Miami Dolphins | 0 | 0 | 10 | 0 | 10 |
| Minnesota Vikings | 3 | 6 | 3 | 3 | 15 |
| Measure | Miami Dolphins | Minnesota Vikings |
|---|---|---|
| First downs | 8 | 20 |
| Total yards | 198 | 336 |
| Yards per play | 5.4 | 4.7 |
| Passing yards | 77 | 213 |
| Rushing yards | 121 | 123 |
| Third-down conversions | 2-9 | 8-18 |
| Red-zone touchdowns / trips | 1-2 | 0-3 |
| Giveaways | 1 | 0 |
| Possession time | 20:49 | 39:11 |
Third-down conversion is shown as its own measure. It is not a substitute for overall play success rate. A dash means the source did not supply that field.
The Lab’s result test
Minnesota Vikings won by 5 points. Q2 supplied the largest scoring swing in the winner’s favor, a +6-points period. The chart shows the result’s path; the box score helps explain what created it.
Miami Dolphins produced 198 total yards; Minnesota Vikings produced 336. Yardage describes how much ground was gained, not whether the most valuable drives were finished.
Minnesota Vikings committed 0 giveaways against the opponent’s 1. That possession advantage gave the winner fewer mistakes to overcome.
The next test is repeatability. Separate staying on schedule from long gains, then examine field position and drive finishing. A large yardage total can coexist with missed scoring chances; a short field can make a modest drive valuable.
Our game coverage

Game played 2026-10-04. These assessments cover the season through October 5, 2026, including this game.
Read the complete Week 4 article →
Dolphins | 0-4
Read the table as text
| Season evidence | Dolphins | Opponents |
|---|---|---|
| Plays keeping pace | 30.5% | 48.0% |
| Long gains | 20 | 24 |
| Points / threatening drives | 46 / 14 | 101 / 22 |
| Defensive takeaways | 3 | 5 |
| Special-teams recoveries | 0 | 0 |
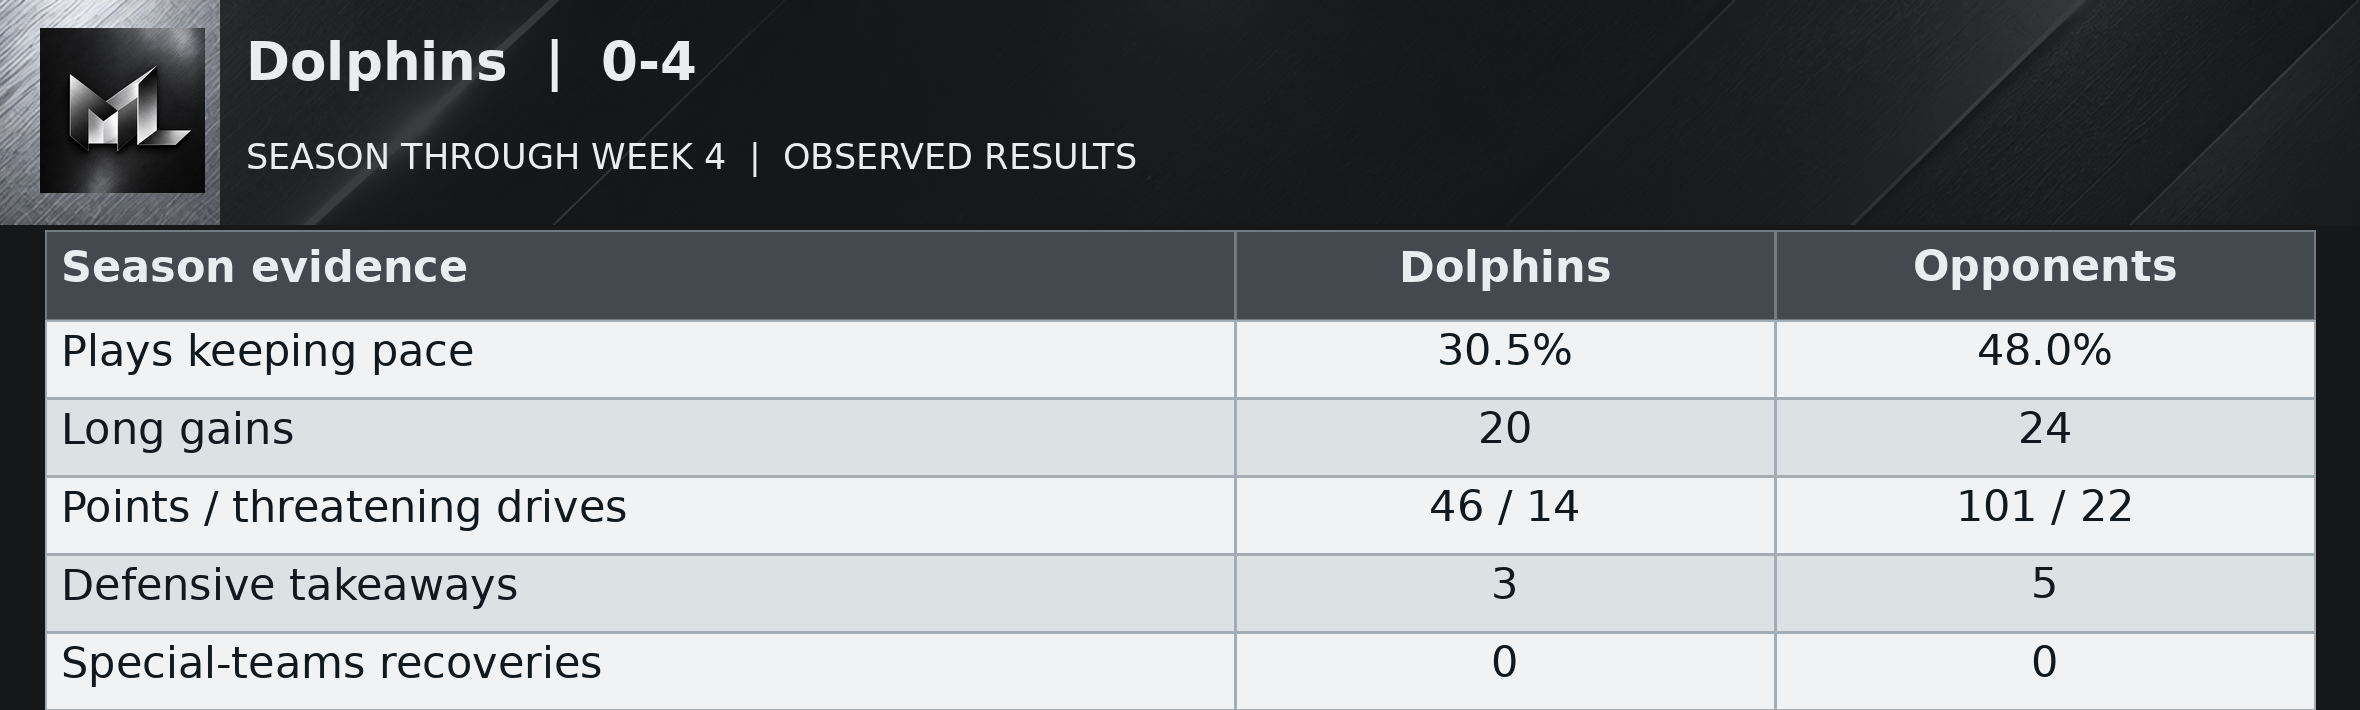
Miami has been the most consistently unsuccessful offense in this season window. Its weekly useful-play shares have stayed in a narrow band from 27.0 to 32.0 percent. That consistency is a problem, not reassurance. Scores of 13, 13, 10 and 10 show the same limitation from another angle. The offense has generated only 14 threatening drives and 46 points from them, while opponents have created 22 and returned 101. Its 20 long gains have not become a regular supply of completed scoring possessions.
Malik Willis said “we’re going out there and competing”. Sunday's 15-10 loss was closer than the previous defeats, but the offense reached threatening territory only twice and lost a fumble. A 53-yard run supplied a shortcut to one scoring chance; the ordinary progress remained weakest in the league's season window. Four sacks were welcome after none in the first three games, though a defense allowing useful gains on 48.0 percent of season plays has more to prove. Competition has become visible. Sustained offense has not.
After opponent punts or failed fourth downs, Dolphins possessions have begun at their own 20.2, on average, across 11 competitive drives. The weekly average has varied widely, from their own 15.3 to their own 27.2. The latest game averaged their own 27.2. The resulting possession started at midfield or closer to the end zone in 0 of those 11 cases. These are actual starting spots, including punt returns, rather than a measure of the defense alone. The return unit has added 24 punt-return yards over the season. Pre-snap changes before the first run or pass affected 1 of these drives; those changes are excluded from the listed starting spots. Starts following turnovers are counted separately: 3 competitive possessions at their opponent 49.7 on average.
Vikings | 4-0
Read the table as text
| Season evidence | Vikings | Opponents |
|---|---|---|
| Plays keeping pace | 32.2% | 30.8% |
| Long gains | 17 | 23 |
| Points / threatening drives | 79 / 18 | 51 / 19 |
| Defensive takeaways | 7 | 2 |
| Special-teams recoveries | 0 | 0 |
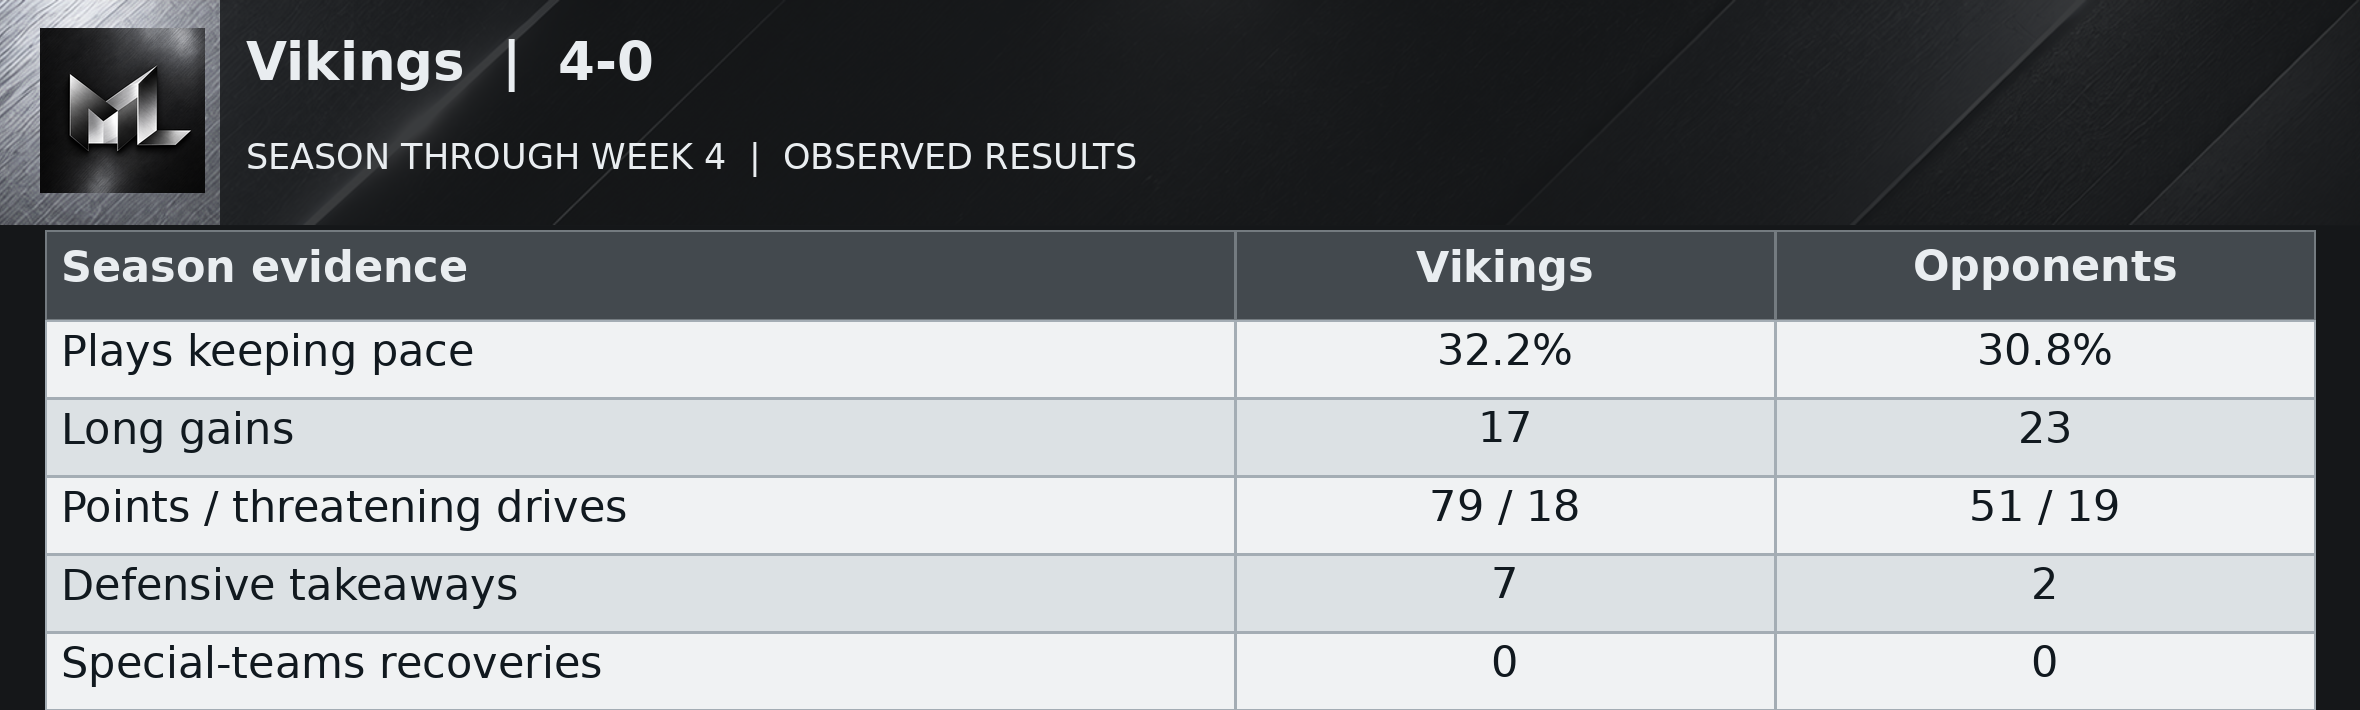
Minnesota is 4-0 with the clearest split between reliable defensive work and unreliable offensive movement. Opponents have made useful gains on only 30.8 percent of their plays and collected 51 offensive points from 19 threatening possessions. The defense has taken the ball away in every game, seven times overall, with no special-teams recoveries in that total. The offense has protected the ball, giving it away twice, but has kept pace with the down on only 32.2 percent of plays.
Kevin O'Connell said “we should do it earlier”. That is a reasonable response to another win without a touchdown. The weekly offensive totals have fallen from 39 to nine to 16 to 15, with a defensive score adding to the Week 3 scoreboard. T.J. Hockenson's late slide Sunday correctly protected the win; it did not explain the possessions before it. Six long gains helped an offense that still spent much of the game searching for normal progress. The defense has earned its undefeated record. The offense has earned a separate conversation.
After opponent punts or failed fourth downs, Vikings possessions have begun at their own 22.7, on average, across 22 competitive drives. The weekly average has varied widely, from their own 17.6 to their own 28.3. The latest game averaged their own 28.3. The resulting possession started at midfield or closer to the end zone in 1 of those 22 cases. These are actual starting spots, including punt returns, rather than a measure of the defense alone. The return unit has added 181 punt-return yards over the season. Pre-snap changes before the first run or pass affected 2 of these drives; those changes are excluded from the listed starting spots. Starts following turnovers are counted separately: 6 competitive possessions at their opponent 45.0 on average.