Denver Broncos 14 · San Francisco 49ers 24
Team assessments and season evidence from our Week 4 recap.
Levi's Stadium · 2026-10-04
The final score was Denver Broncos 14 · San Francisco 49ers 24. The breakdown below uses this game’s figures, separate from season averages.
The scoring path
| Team | Q1 | Q2 | Q3 | Q4 | Final |
|---|---|---|---|---|---|
| Denver Broncos | 3 | 0 | 0 | 11 | 14 |
| San Francisco 49ers | 0 | 3 | 7 | 14 | 24 |
| Measure | Denver Broncos | San Francisco 49ers |
|---|---|---|
| First downs | 16 | 20 |
| Total yards | 296 | 358 |
| Yards per play | 4.6 | 5.5 |
| Passing yards | 214 | 218 |
| Rushing yards | 82 | 140 |
| Third-down conversions | 8-17 | 6-13 |
| Red-zone touchdowns / trips | 1-1 | 2-3 |
| Giveaways | 1 | 0 |
| Possession time | 30:53 | 29:07 |
Third-down conversion is shown as its own measure. It is not a substitute for overall play success rate. A dash means the source did not supply that field.
The Lab’s result test
San Francisco 49ers won by 10 points. Q3 supplied the largest scoring swing in the winner’s favor, a +7-points period. The chart shows the result’s path; the box score helps explain what created it.
Denver Broncos produced 296 total yards; San Francisco 49ers produced 358. Yardage describes how much ground was gained, not whether the most valuable drives were finished.
San Francisco 49ers committed 0 giveaways against the opponent’s 1. That possession advantage gave the winner fewer mistakes to overcome.
The next test is repeatability. Separate staying on schedule from long gains, then examine field position and drive finishing. A large yardage total can coexist with missed scoring chances; a short field can make a modest drive valuable.
Our game coverage
A matching published game video is not available in the verified archive yet.
Game played 2026-10-04. These assessments cover the season through October 5, 2026, including this game.
Read the complete Week 4 article →
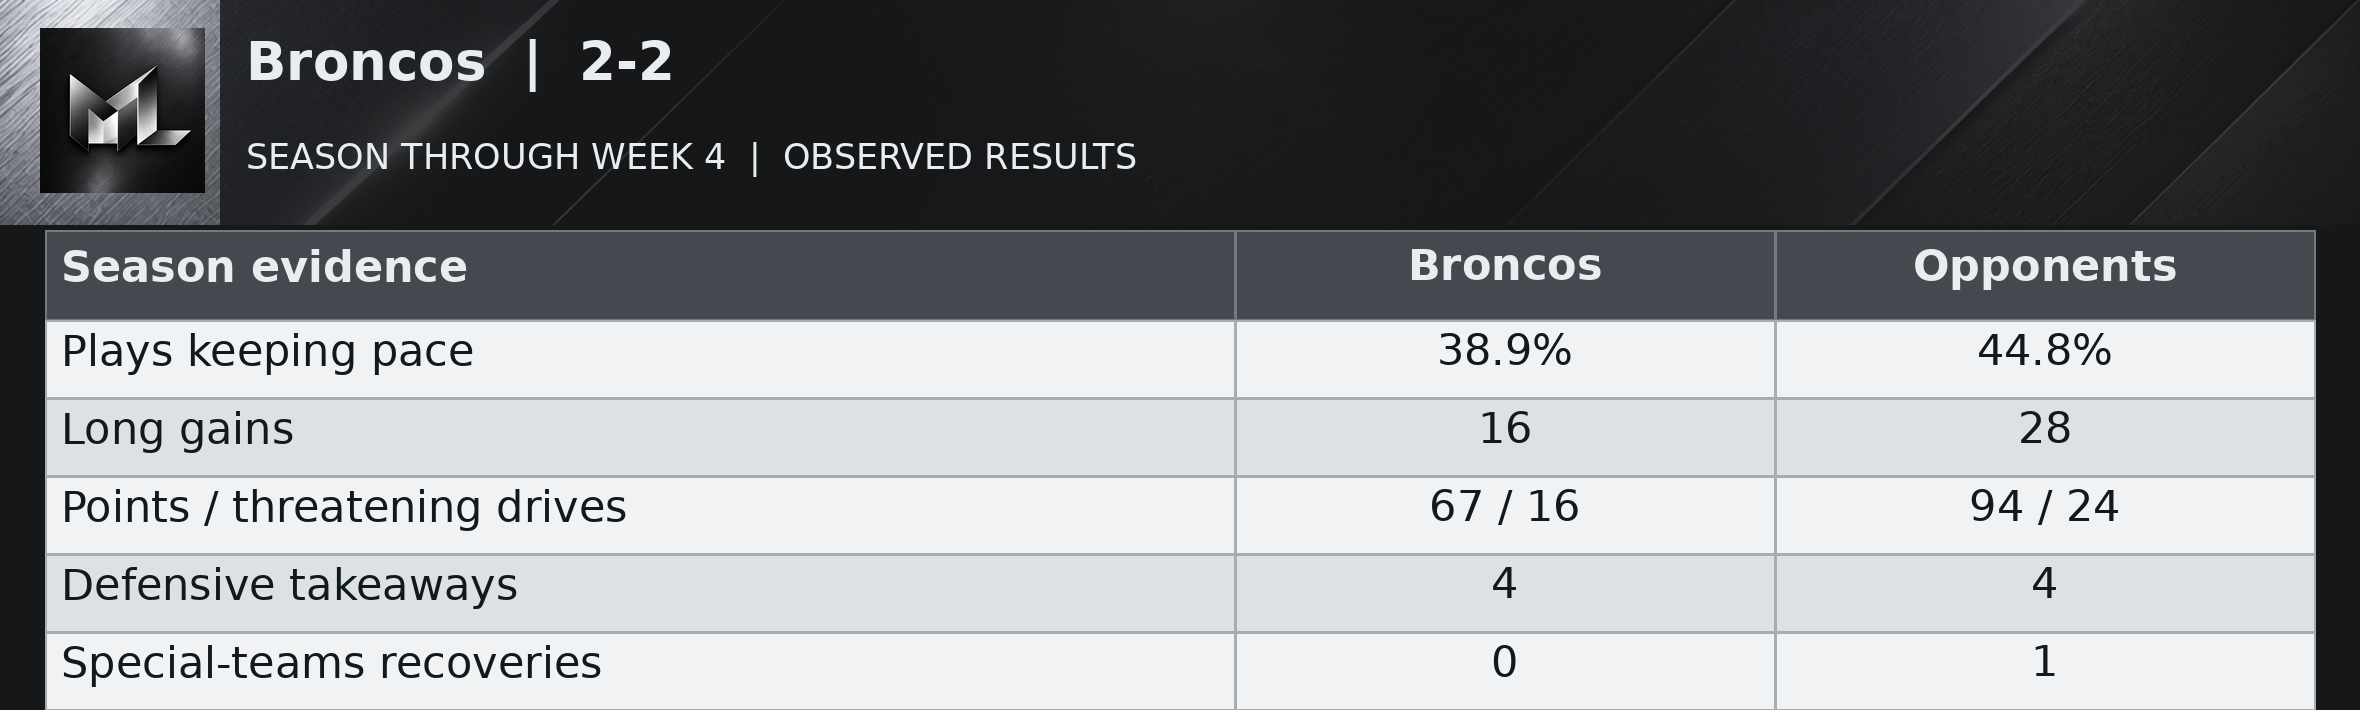
Broncos | 2-2
Read the table as text
| Season evidence | Broncos | Opponents |
|---|---|---|
| Plays keeping pace | 38.9% | 44.8% |
| Long gains | 16 | 28 |
| Points / threatening drives | 67 / 16 | 94 / 24 |
| Defensive takeaways | 4 | 4 |
| Special-teams recoveries | 0 | 1 |
Denver's offense has been inconsistent at finding long gains and consistently limited in the number of serious scoring chances it creates. Its weekly long gains have run one, nine, four and two. Across four games it has produced only 16 threatening possessions, against 24 for opponents. The defense has allowed 28 long gains while the offense has created 16. The two wins show that the Broncos can assemble enough offense; the losses show how little remains when the big gains shrink.
Sean Payton said “We just didn’t have enough offense”. Sunday's 24-14 defeat fits the full-season concern, with only two long gains and useful progress on 39.1 percent of plays. Marvin Mims Jr.'s muffed punt handed San Francisco its breakthrough touchdown possession. That was a special-teams giveaway and the only Denver giveaway Sunday, rather than evidence of an offensive interception habit. Four defensive takeaways over the season have not erased five team giveaways. At 2-2, Denver needs more possessions that threaten before it needs another late comeback.
After opponent punts or failed fourth downs, Broncos possessions have begun at their own 22.8, on average, across 16 competitive drives. The weekly average has varied widely, from their own 14.8 to their own 37.2. The latest game averaged their own 24.5. The resulting possession started at midfield or closer to the end zone in 1 of those 16 cases. These are actual starting spots, including punt returns, rather than a measure of the defense alone. The return unit has added 78 punt-return yards over the season. Pre-snap changes before the first run or pass affected 1 of these drives; those changes are excluded from the listed starting spots. Starts following turnovers are counted separately: 2 competitive possessions at their opponent 34.5 on average.
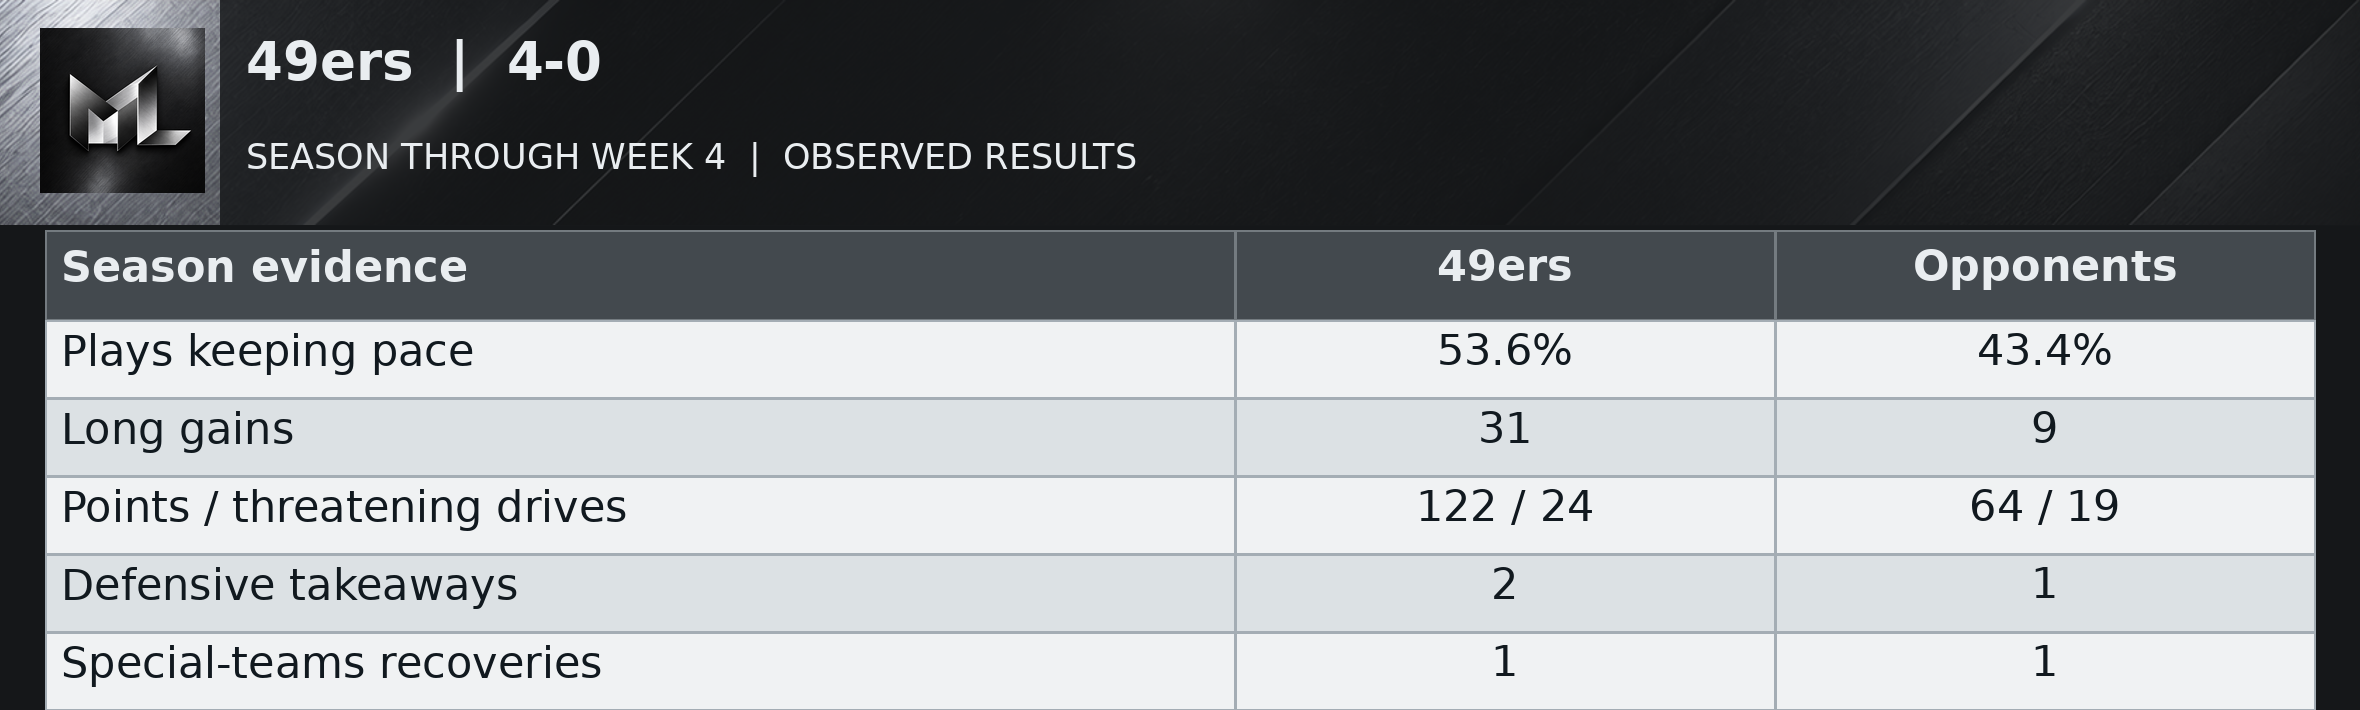
49ers | 4-0
Read the table as text
| Season evidence | 49ers | Opponents |
|---|---|---|
| Plays keeping pace | 53.6% | 43.4% |
| Long gains | 31 | 9 |
| Points / threatening drives | 122 / 24 | 64 / 19 |
| Defensive takeaways | 2 | 1 |
| Special-teams recoveries | 1 | 1 |
San Francisco has the strongest season case because its offense has repeatedly combined ordinary gains with the ability to shorten a possession in one snap. It has stayed ahead of the down on 53.6 percent of its qualifying plays and produced 31 long gains while allowing only nine. The 4-0 record has more underneath it than a collection of fortunate endings. Still, Sunday's 24-14 win was its weakest game at keeping possessions moving, and the opening seven possessions produced just three points.
Brock Purdy said he wanted to “just be ourselves”. That finally happened, but a muffed Denver punt helped open the door. The recovery was a special-teams play, not an interception or a strip by the defense. The subsequent 74-yard touchdown drive and George Kittle's 56-yard score were better evidence of what the offense can create for itself. Two giveaways through four games remain a strength. Being unbeaten does not exempt the slow start from review.
After opponent punts or failed fourth downs, 49ers possessions have begun at their own 21.4, on average, across 17 competitive drives. The weekly average has varied widely, from their own 12.8 to their own 37.2. The latest game averaged their own 12.8. The resulting possession started at midfield or closer to the end zone in 2 of those 17 cases. These are actual starting spots, including punt returns, rather than a measure of the defense alone. The return unit has added 25 punt-return yards over the season. Pre-snap changes before the first run or pass affected 1 of these drives; those changes are excluded from the listed starting spots. Starts following turnovers are counted separately: 3 competitive possessions at their own 47.7 on average.
Week 4 daytime roundup
This is the multi-game edition, rather than a dedicated recap.