
Arizona Cardinals 24 · New York Giants 36
Team assessments and season evidence from our Week 4 recap.
MetLife Stadium · 2026-10-04
The final score was Arizona Cardinals 24 · New York Giants 36. The breakdown below uses this game’s figures, separate from season averages.
 Arizona Cardinals
 New York Giants
The scoring path
| Team | Q1 | Q2 | Q3 | Q4 | Final |
|---|---|---|---|---|---|
| Arizona Cardinals | 14 | 3 | 7 | 0 | 24 |
| New York Giants | 3 | 16 | 8 | 9 | 36 |
| Measure | Arizona Cardinals | New York Giants |
|---|---|---|
| First downs | 19 | 17 |
| Total yards | 270 | 319 |
| Yards per play | 4.3 | 5.2 |
| Passing yards | 147 | 232 |
| Rushing yards | 123 | 87 |
| Third-down conversions | 4-12 | 7-15 |
| Red-zone touchdowns / trips | 2-3 | 2-3 |
| Giveaways | 3 | 3 |
| Possession time | 27:47 | 32:13 |
Third-down conversion is shown as its own measure. It is not a substitute for overall play success rate. A dash means the source did not supply that field.
The Lab’s result test
New York Giants won by 12 points. Q2 supplied the largest scoring swing in the winner’s favor, a +13-points period. The chart shows the result’s path; the box score helps explain what created it.
Arizona Cardinals produced 270 total yards; New York Giants produced 319. Yardage describes how much ground was gained, not whether the most valuable drives were finished.
New York Giants committed 3 giveaways against the opponent’s 3. The giveaway counts were level, so that total alone does not separate these teams.
The next test is repeatability. Separate staying on schedule from long gains, then examine field position and drive finishing. A large yardage total can coexist with missed scoring chances; a short field can make a modest drive valuable.
Our game coverage

Game played 2026-10-04. These assessments cover the season through October 5, 2026, including this game.
Read the complete Week 4 article →
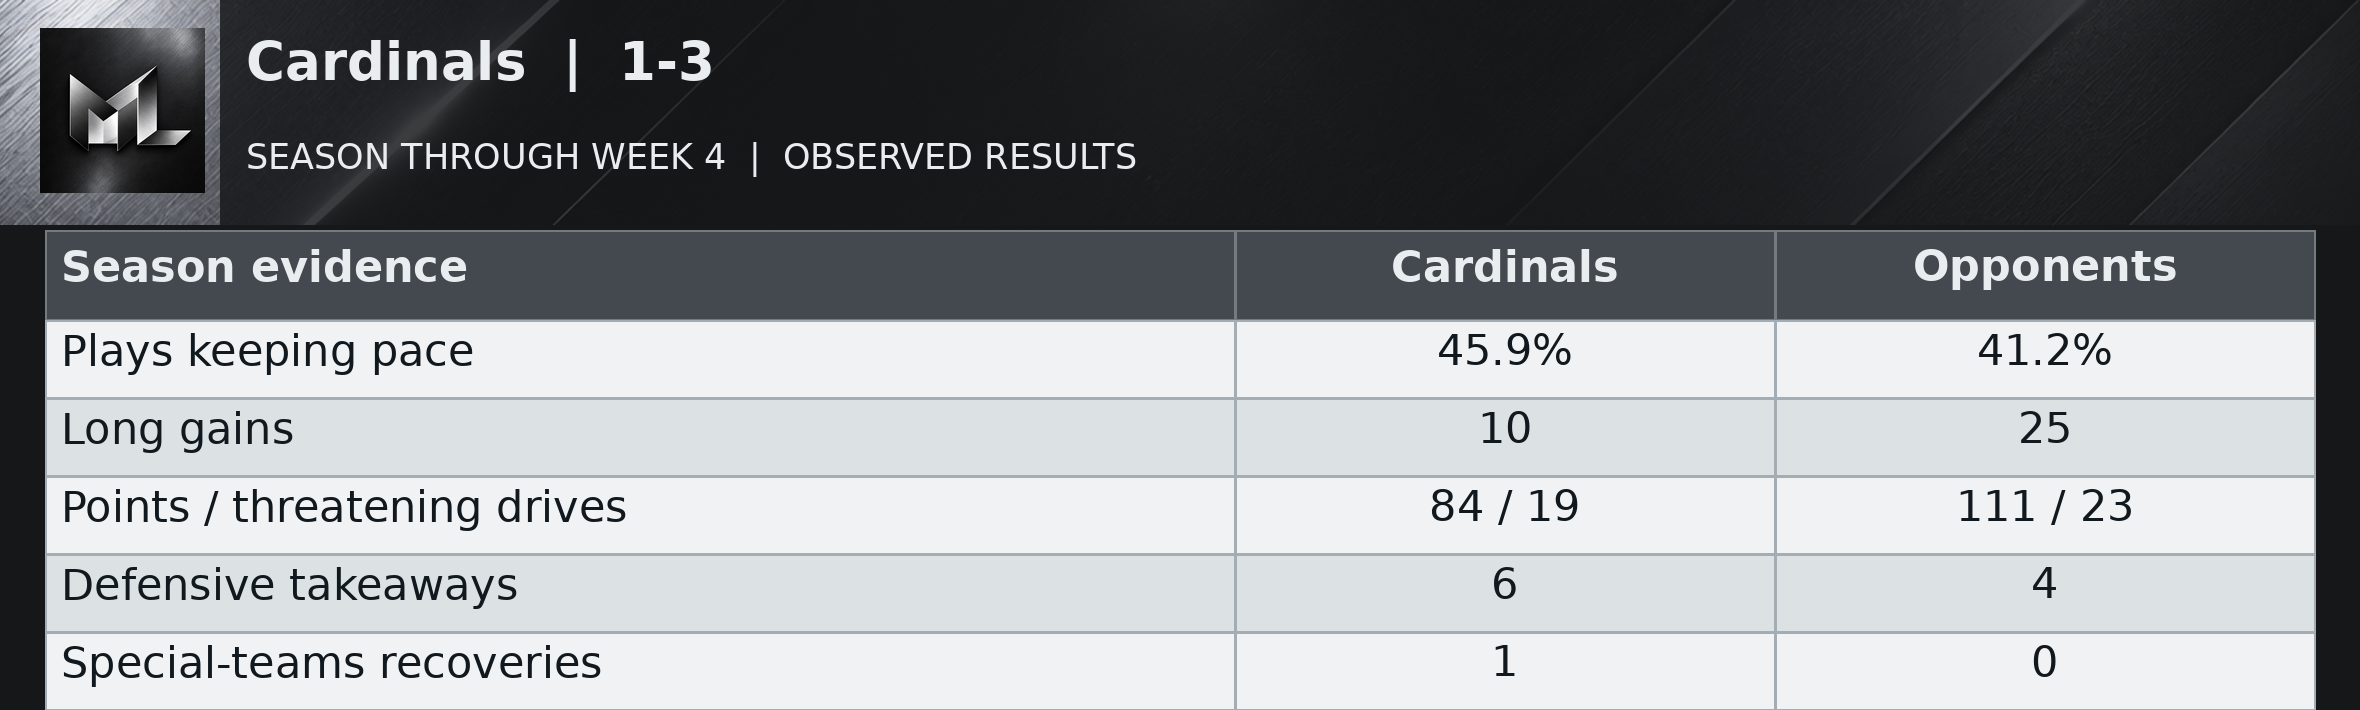
Cardinals | 1-3
Read the table as text
| Season evidence | Cardinals | Opponents |
|---|---|---|
| Plays keeping pace | 45.9% | 41.2% |
| Long gains | 10 | 25 |
| Points / threatening drives | 84 / 19 | 111 / 23 |
| Defensive takeaways | 6 | 4 |
| Special-teams recoveries | 1 | 0 |
Arizona can make ordinary progress, but it rarely shortens the job with a long gain. Its offense has produced only 10 long runs or passes across four games while allowing 25. The contrast has persisted even when the offense moved well: Week 3 contained no qualifying long gains despite a 53.8 percent share of useful plays. That makes repeated clean execution important, and the latest game supplied the opposite. Three giveaways interrupted a 36-24 loss after a 14-3 lead.
Jacoby Brissett said “you can’t have three interceptions”. That is the straightforward diagnosis for Sunday, though it should not be rewritten as four weeks of the same mistake. Arizona had only one giveaway in the first three games combined. Six of its seven takeaways were defensive, with one special-teams recovery. Opponents have collected 111 offensive points from 23 threatening drives compared with Arizona's 84 from 19. The Cardinals' 1-3 record reflects both insufficient quick offense and too little resistance once opponents arrive near scoring territory.
After opponent punts or failed fourth downs, Cardinals possessions have begun at their own 22.1, on average, across 13 competitive drives. The weekly average has varied widely, from their own 14.7 to their own 29.0. The latest game averaged their own 15.7. The resulting possession started at midfield or closer to the end zone in 1 of those 13 cases. These are actual starting spots, including punt returns, rather than a measure of the defense alone. The return unit has added 32 punt-return yards over the season. Starts following turnovers are counted separately: 7 competitive possessions at their own 41.1 on average.
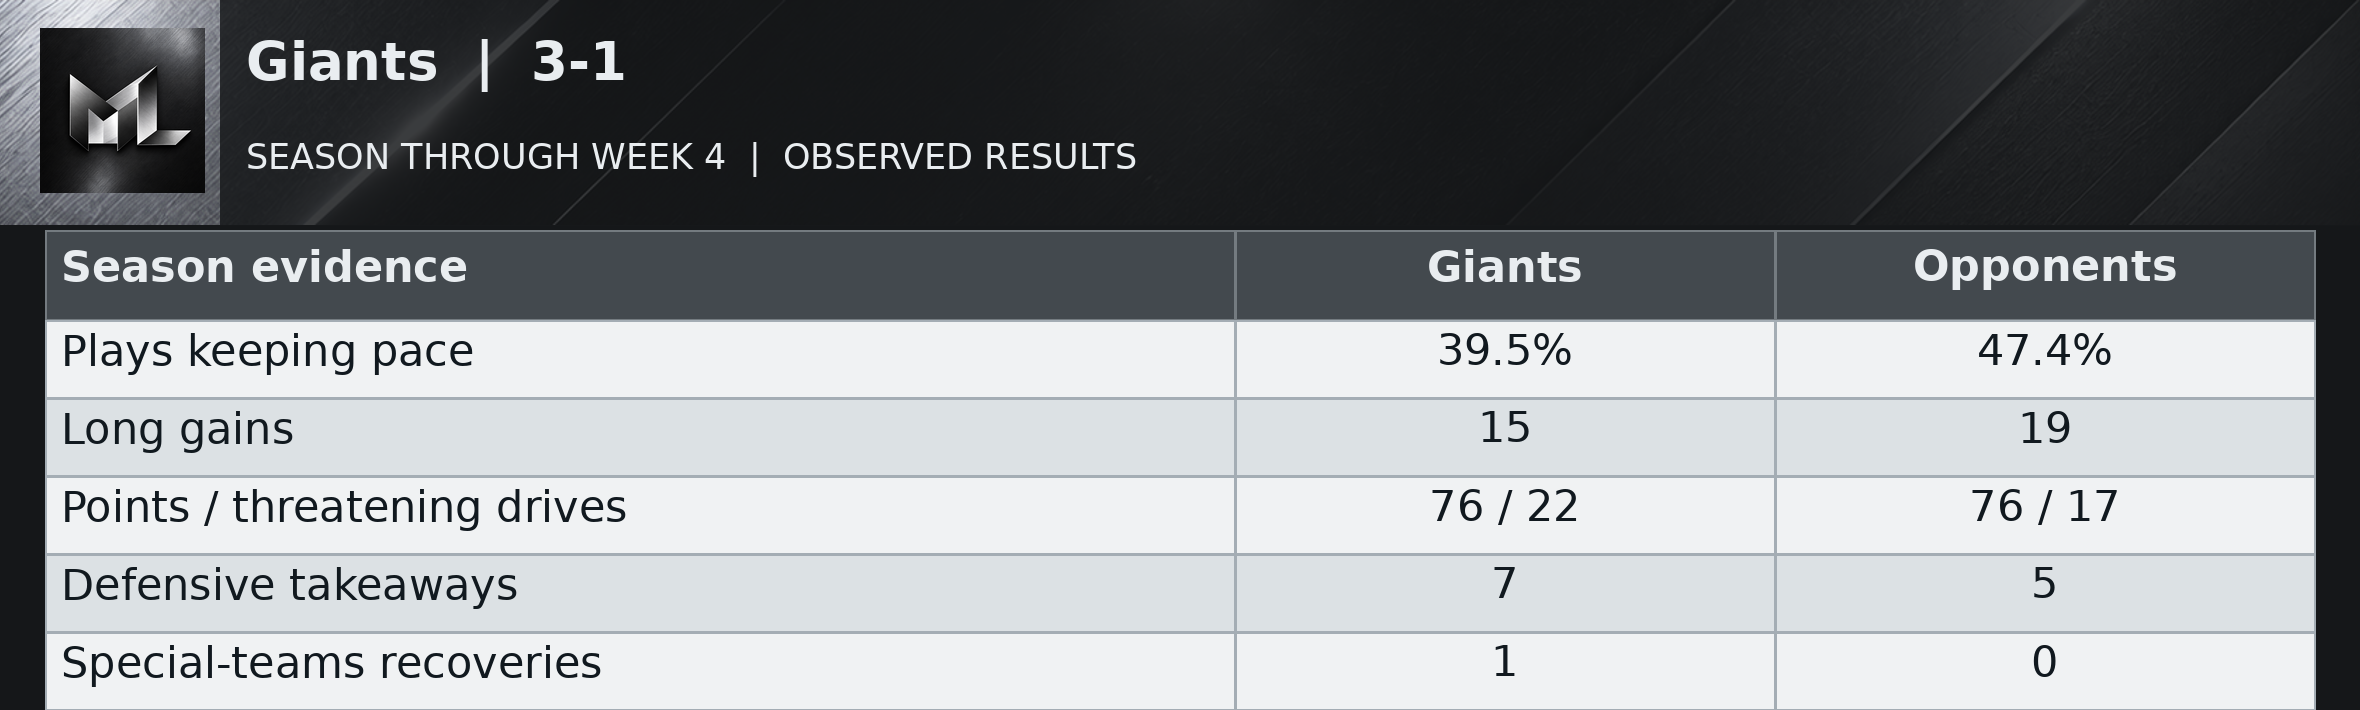
Giants | 3-1
Read the table as text
| Season evidence | Giants | Opponents |
|---|---|---|
| Plays keeping pace | 39.5% | 47.4% |
| Long gains | 15 | 19 |
| Points / threatening drives | 76 / 22 | 76 / 17 |
| Defensive takeaways | 7 | 5 |
| Special-teams recoveries | 1 | 0 |
The Giants' 3-1 record sits beside a much shakier offensive season. Their useful-play share fell from 60.0 percent in the opener to 27.3, 36.8 and 31.1. The offense scored six and 12 in the middle two games before producing 30 Sunday, with a defensive touchdown raising the latest scoreboard to 36. Seven of eight season takeaways were defensive. That repeated ability to steal possession has mattered more than the offense's ordinary movement, while five giveaways have complicated the benefit.
John Harbaugh called Sunday “a winning game”. Correct, and incomplete as a diagnosis. The 36-24 result included a 98-yard interception return that sealed the outcome, three interceptions collected overall and three giveaways by New York. A defensive score does not mean the offense finished another drive. The Giants also allowed Arizona two long early touchdown marches before tightening. Finding ways to win is useful. An offense that has struggled between isolated scoring plays for three straight weeks needs more than the record as its defense.
After opponent punts or failed fourth downs, Giants possessions have begun at their own 25.5, on average, across 17 competitive drives. The weekly average has varied widely, from their own 14.0 to their own 35.7. The latest game averaged their own 35.7. The resulting possession started at midfield or closer to the end zone in 1 of those 17 cases. These are actual starting spots, including punt returns, rather than a measure of the defense alone. The return unit has added 41 punt-return yards over the season. Pre-snap changes before the first run or pass affected 2 of these drives; those changes are excluded from the listed starting spots. Starts following turnovers are counted separately: 6 competitive possessions at their opponent 44.7 on average.