
Tennessee Volunteers at Arkansas Razorbacks
2026-10-10 · 3:15 PM CT · Scheduled
ESPN standings data retrieved October 6, 2026. 2026 season totals at this snapshot.
| Measure | Tennessee Volunteers | Arkansas Razorbacks |
|---|---|---|
| Record | 4-1 | 2-3 |
| Points scored / game | 36.8 | 19.8 |
| Points allowed / game | 15.2 | 28.4 |
| Points differential | +108 | -43 |
How this game can be won
Tennessee Volunteers average 36.8 points scored and 15.2 allowed; Arkansas Razorbacks average 19.8 scored and 28.4 allowed. The first question is whether each offense can make ordinary downs useful. Repeated manageable gains keep more of the playbook available.
Watch the long gains separately. An offense can move steadily without breaking a big play, or spend an afternoon waiting for one big play to rescue it. The more repeatable approach is the one that can still move the ball when the defense removes its easiest option.
Field position changes the job. Starting near midfield means fewer yards are needed before a scoring chance. Once the drive reaches threatening territory, watch whether the offense finishes it with useful points instead of wasting the trip.
Finally, count the lost possessions. Turnovers can change a close game without explaining every down that came before them. Our football model needs efficiency, explosive-play rate, starting field position, drive finishing and turnover margin together. A scoring average or a third-down rate cannot replace that set.
Our matchup simulation
ESPN 2026 college-football drive and play records, August 20–October 5. We apply the Lab measures, fit their relationship to the scoring margin, then sample possible results from the scoring errors observed in completed games.
 Tennessee Volunteers70.0%
 Arkansas Razorbacks30.0%
Standard deviation shows how widely the simulated scoring margins vary. A larger number means a less steady outcome; it is not the error bar on the win percentage.
Tennessee VolunteersArkansas Razorbacks
Where the factor edge comes from
| Lab measure | Weight | Home − away · z | Baseline margin effect |
|---|---|---|---|
| Efficiency | 40% | -0.85 | -4.3 pts |
| Explosiveness | 25% | -1.54 | -4.8 pts |
| Field position | 10% | -1.30 | -1.6 pts |
| Finishing drives | 15% | -2.56 | -4.8 pts |
| Turnovers | 10% | -1.91 | -2.4 pts |
Positive effects favor Arkansas Razorbacks; negative effects favor Tennessee Volunteers. Both offense and defense enter the net factors. Home-court / field term +7.8 points. These effects explain the fitted baseline; the simulation also varies its fitted coefficients and game outcomes.
Model inputs, variability and validation
League-average play/drive priors; 50/70/100 percent success thresholds by down, 10-yard rushing and 20-yard passing explosive thresholds. Defensive rates are included. Turnovers use offensive drives ending in an interception or lost fumble; special-teams muffs are excluded. Football editorial weights 40/25/10/15/10 percent. Profiles use Completed games through October 5, 2026. Historical calibration uses only each game’s earlier factor data; 113 completed games fit the margin and home advantage.
Chronological check 58 held-out games; margin RMSE 20.8 points; Brier score 0.224 (50/50 baseline 0.250; lower is better). The final fit then uses all available earlier games. This check is not proof of future calibration.
Outcome noise resamples observed scoring-margin errors, preserving the shape of the available results instead of imposing a bell curve. Bootstrap fits capture some uncertainty in the fitted coefficients. Between-batch win-rate standard deviation 4.9 percentage points. Monte Carlo sampling standard error 0.14 percentage points applies to the unsplit positive-margin frequency; it excludes model error. Zero-margin trials (1.3%) are split equally to estimate the final winner. That is an explicit overtime assumption, not a modeled overtime system.
Injuries, starting lineup changes, rest, travel and postseason rotation changes are not adjusted. The model uses no market odds. Forecast snapshot October 6 at 10:49 AM CT; only confirmed regular-season or playoff games in the following seven days qualify.
Tennessee Volunteers · our 2026-10-04 assessment
Tennessee
4-1 overall | Preview AP No. 17 | Matchup Lab No. 17 | Index 65.7
Tennessee's season profile remains more persuasive on big plays and scoring outcomes than on steady offensive progress. It averages 240.6 rushing yards, but its successful-play rate is only marginally above the rate it allows. The offensive weekly range runs from 32.9 to 53.7 percent. A strong rushing total can therefore include stretches where the offense struggles to keep a drive alive.
The 24-14 win over Auburn illustrated the distinction. DeSean Bishop supplied all three touchdowns, including scoring runs of 25 and 44 yards. Tennessee finished with 237 rushing yards but only 86 passing, and converted three of 14 third downs. Two fourth-down conversions helped. The touchdown runs mattered because the ordinary route was not consistently working.
Auburn's three giveaways, compared with Tennessee's two, helped the Volunteers survive another uneven offensive day. Auburn still rushed for 186 yards at 5.8 per attempt. Tennessee's season defensive scoring average of 15.2 is valuable, but the latest result does not mean opponents are unable to move it. Friday's preview emphasized the contrast between explosive offense and sustained progress. Saturday left that distinction intact. Bishop found the end zone; the third-down offense is still looking for directions.
Across the season, qualifying stops have handed the offense an average start at its own 30.9 over 34 possessions. Game averages range from its own 20.8 to 36.6. In the narrower 25-possession sample without an identified return or penalty effect, the average is its own 28.4. The stops provide opportunities, but generally still leave a long drive to complete. The offense has produced an estimated 4.78 points before extra points per scoring opportunity. That payoff must be read alongside how often it can build the next drive.
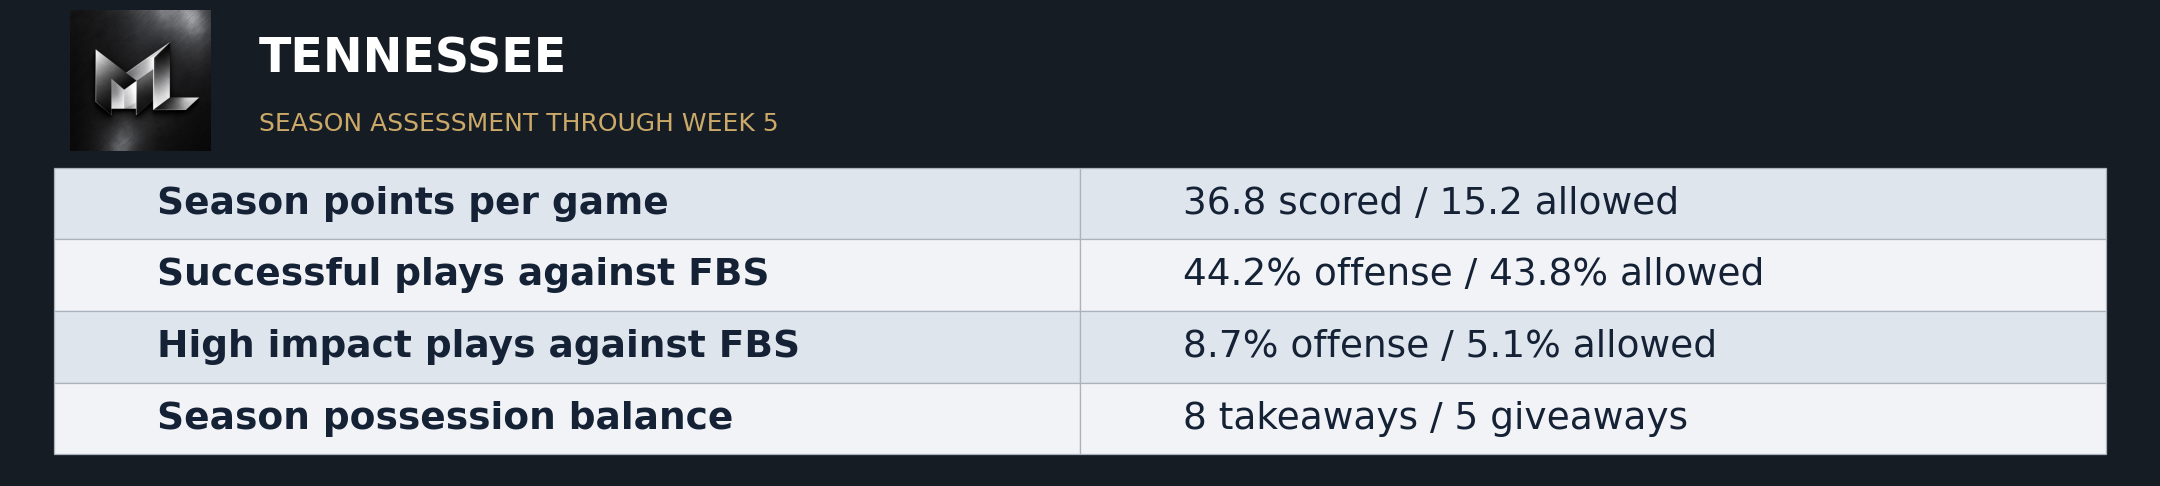
| Season points per game | 36.8 scored / 15.2 allowed |
| Successful plays against FBS | 44.2% offense / 43.8% allowed |
| High impact plays against FBS | 8.7% offense / 5.1% allowed |
| Season possession balance | 8 takeaways / 5 giveaways |
Our coverage of these teams
A matching published game video is not available in the verified archive yet.