
LSU Tigers at Kentucky Wildcats
2026-10-10 · 6:00 PM CT · Scheduled
ESPN standings data retrieved October 6, 2026. 2026 season totals at this snapshot.
| Measure | LSU Tigers | Kentucky Wildcats |
|---|---|---|
| Record | 4-1 | 4-1 |
| Points scored / game | 43.6 | 34.6 |
| Points allowed / game | 15.2 | 26.8 |
| Points differential | +142 | +39 |
How this game can be won
LSU Tigers average 43.6 points scored and 15.2 allowed; Kentucky Wildcats average 34.6 scored and 26.8 allowed. The first question is whether each offense can make ordinary downs useful. Repeated manageable gains keep more of the playbook available.
Watch the long gains separately. An offense can move steadily without breaking a big play, or spend an afternoon waiting for one big play to rescue it. The more repeatable approach is the one that can still move the ball when the defense removes its easiest option.
Field position changes the job. Starting near midfield means fewer yards are needed before a scoring chance. Once the drive reaches threatening territory, watch whether the offense finishes it with useful points instead of wasting the trip.
Finally, count the lost possessions. Turnovers can change a close game without explaining every down that came before them. Our football model needs efficiency, explosive-play rate, starting field position, drive finishing and turnover margin together. A scoring average or a third-down rate cannot replace that set.
Our matchup simulation
ESPN 2026 college-football drive and play records, August 20–October 5. We apply the Lab measures, fit their relationship to the scoring margin, then sample possible results from the scoring errors observed in completed games.
 LSU Tigers45.2%
 Kentucky Wildcats54.8%
Standard deviation shows how widely the simulated scoring margins vary. A larger number means a less steady outcome; it is not the error bar on the win percentage.
LSU TigersKentucky Wildcats
Where the factor edge comes from
| Lab measure | Weight | Home − away · z | Baseline margin effect |
|---|---|---|---|
| Efficiency | 40% | -0.84 | -4.2 pts |
| Explosiveness | 25% | +0.06 | +0.2 pts |
| Field position | 10% | -1.04 | -1.3 pts |
| Finishing drives | 15% | -0.02 | -0.0 pts |
| Turnovers | 10% | +1.30 | +1.6 pts |
Positive effects favor Kentucky Wildcats; negative effects favor LSU Tigers. Both offense and defense enter the net factors. Home-court / field term +7.8 points. These effects explain the fitted baseline; the simulation also varies its fitted coefficients and game outcomes.
Model inputs, variability and validation
League-average play/drive priors; 50/70/100 percent success thresholds by down, 10-yard rushing and 20-yard passing explosive thresholds. Defensive rates are included. Turnovers use offensive drives ending in an interception or lost fumble; special-teams muffs are excluded. Football editorial weights 40/25/10/15/10 percent. Profiles use Completed games through October 5, 2026. Historical calibration uses only each game’s earlier factor data; 113 completed games fit the margin and home advantage.
Chronological check 58 held-out games; margin RMSE 20.8 points; Brier score 0.224 (50/50 baseline 0.250; lower is better). The final fit then uses all available earlier games. This check is not proof of future calibration.
Outcome noise resamples observed scoring-margin errors, preserving the shape of the available results instead of imposing a bell curve. Bootstrap fits capture some uncertainty in the fitted coefficients. Between-batch win-rate standard deviation 4.8 percentage points. Monte Carlo sampling standard error 0.16 percentage points applies to the unsplit positive-margin frequency; it excludes model error. Zero-margin trials (2.2%) are split equally to estimate the final winner. That is an explicit overtime assumption, not a modeled overtime system.
Injuries, starting lineup changes, rest, travel and postseason rotation changes are not adjusted. The model uses no market odds. Forecast snapshot October 6, 2026 at 1:13 PM UTC-05:00; only confirmed regular-season or playoff games in the following seven days qualify.
LSU Tigers · our 2026-10-04 assessment
LSU
4-1 overall | Preview AP No. 11 | Matchup Lab No. 9 | Index 73.7
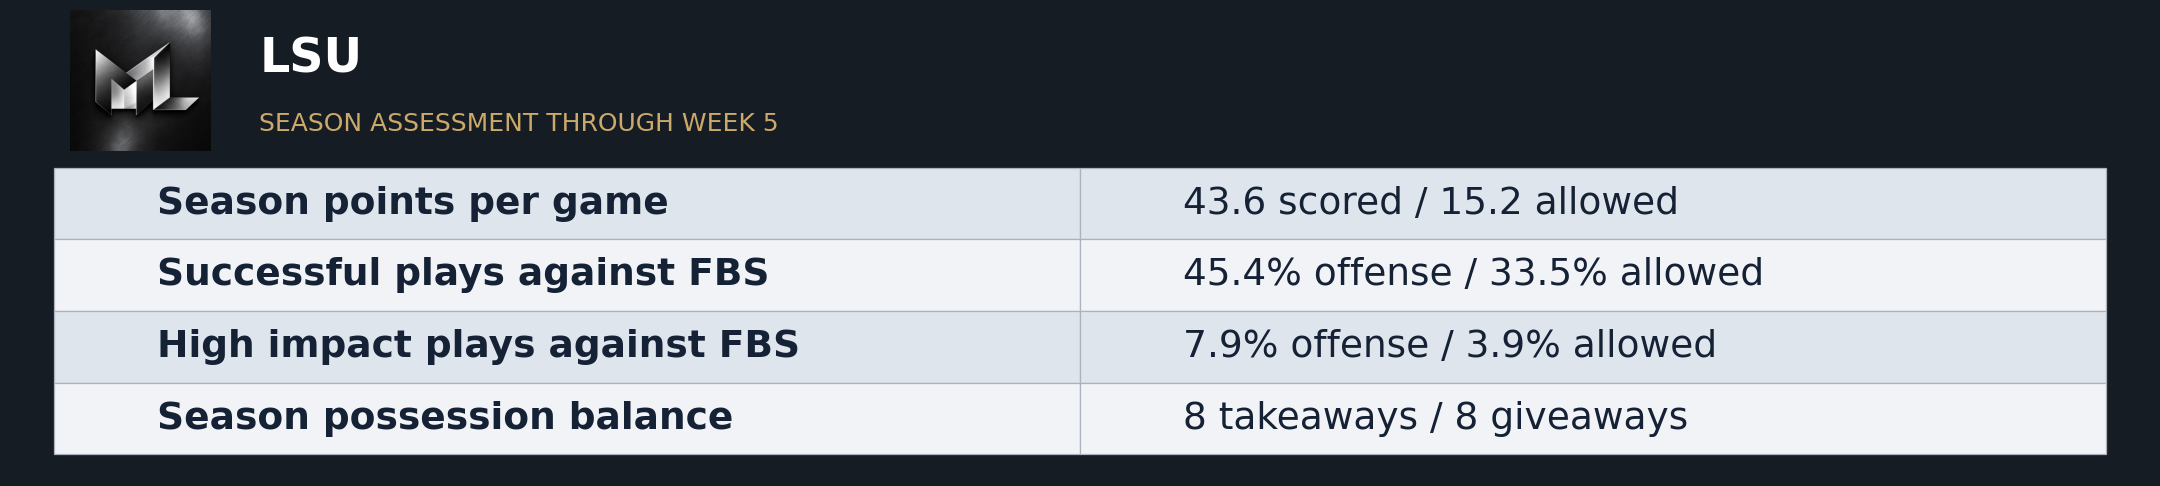
LSU's season case is strongest on defense. The Tigers allow 220.6 yards and 58.4 rushing yards per game, and their FBS opponents generate successful plays on only 33.5 percent of snaps. The offense has been less uniformly persuasive beneath its scoring totals. Its charted FBS successful-play rate stepped down from 49.5 to 44.7, 44.9 and 40.9 percent before this week's FCS matchup.
The 63-14 win over McNeese produced 731 yards, 39 first downs and 367 rushing yards. LSU converted all three fourth downs and held McNeese to one third-down conversion in 12 attempts. Those are useful execution details. They also came against a different level of opposition, exactly the caution raised in Friday's preview. McNeese does not enter the FBS-only successful-play sample used above.
LSU lost and gained one turnover, leaving its season balance even at eight each. Its scoring-opportunity return still leaves room to improve against more demanding opponents. The latest total should not erase that distinction. The performance index can fall after a large win because it re-evaluates the full opponent network, standardizes against all FBS teams and caps a game's influence. This result supplied a productive afternoon, not a new reason to ignore what happened against stronger opposition.
Across the season, qualifying stops have handed the offense an average start at its own 30.6 over 37 possessions. Game averages range from its own 21.6 to 40.3. In the narrower 30-possession sample without an identified return or penalty effect, the average is its own 29.4. The stops provide opportunities, but generally still leave a long drive to complete. The offense has produced an estimated 4.16 points before extra points per scoring opportunity. That payoff must be read alongside how often it can build the next drive.
| Season points per game | 43.6 scored / 15.2 allowed |
| Successful plays against FBS | 45.4% offense / 33.5% allowed |
| High impact plays against FBS | 7.9% offense / 3.9% allowed |
| Season possession balance | 8 takeaways / 8 giveaways |
Kentucky Wildcats · our 2026-10-04 assessment
Kentucky
4-1 overall | Preview AP No. 24 | Matchup Lab No. 27 | Index 62.2
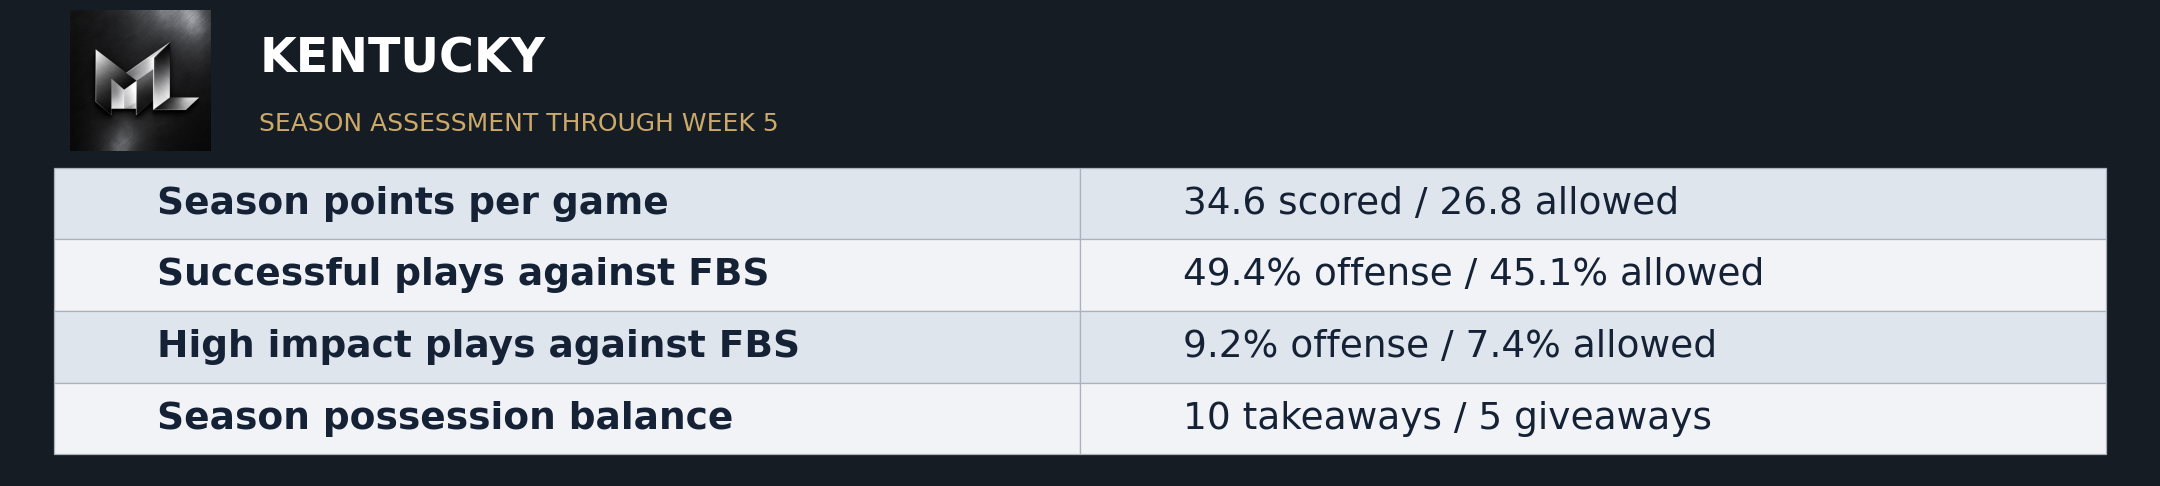
Kentucky's offense has recovered from its low point against Alabama, while its defense remains less predictable. After a 33.3 percent offensive successful-play rate in that charted game, its next three were above 52 percent. Defensive results have swung more sharply. The Wildcats' five-game turnover balance is plus five, and that possession advantage has helped them survive games in which opponents move the ball well.
The 35-34 overtime escape at South Carolina made both sides of the profile visible. Kentucky gave the ball away zero times and recovered two Gamecocks fumbles, yet was outgained 458-394. South Carolina rushed for 232 yards and converted half its third downs. Kentucky converted only four of 14 third downs but both fourth-down attempts, then won on the two-point conversion.
Friday's preview warned that Kentucky could not rely on repeatedly rescuing third down. That concern remains. The Wildcats found enough alternative routes to finish the game, but those routes included takeaways, fourth downs and an overtime decision. The offense's recent early-play improvement is real evidence; the defense's inability to prevent long productive stretches is also real. Kentucky earned the win. It did not earn a quiet review of the first 60 minutes.
Across the season, qualifying stops have handed the offense an average start at its own 31.3 over 25 possessions. Game averages range from its own 10.0 to 37.6. In the narrower 18-possession sample without an identified return or penalty effect, the average is its own 34.0. That is useful territorial support, although the opponent's kicking remains part of it. The offense has produced an estimated 4.31 points before extra points per scoring opportunity. That payoff must be read alongside how often it can build the next drive.
| Season points per game | 34.6 scored / 26.8 allowed |
| Successful plays against FBS | 49.4% offense / 45.1% allowed |
| High impact plays against FBS | 9.2% offense / 7.4% allowed |
| Season possession balance | 10 takeaways / 5 giveaways |
Our coverage of these teams
A matching published game video is not available in the verified archive yet.